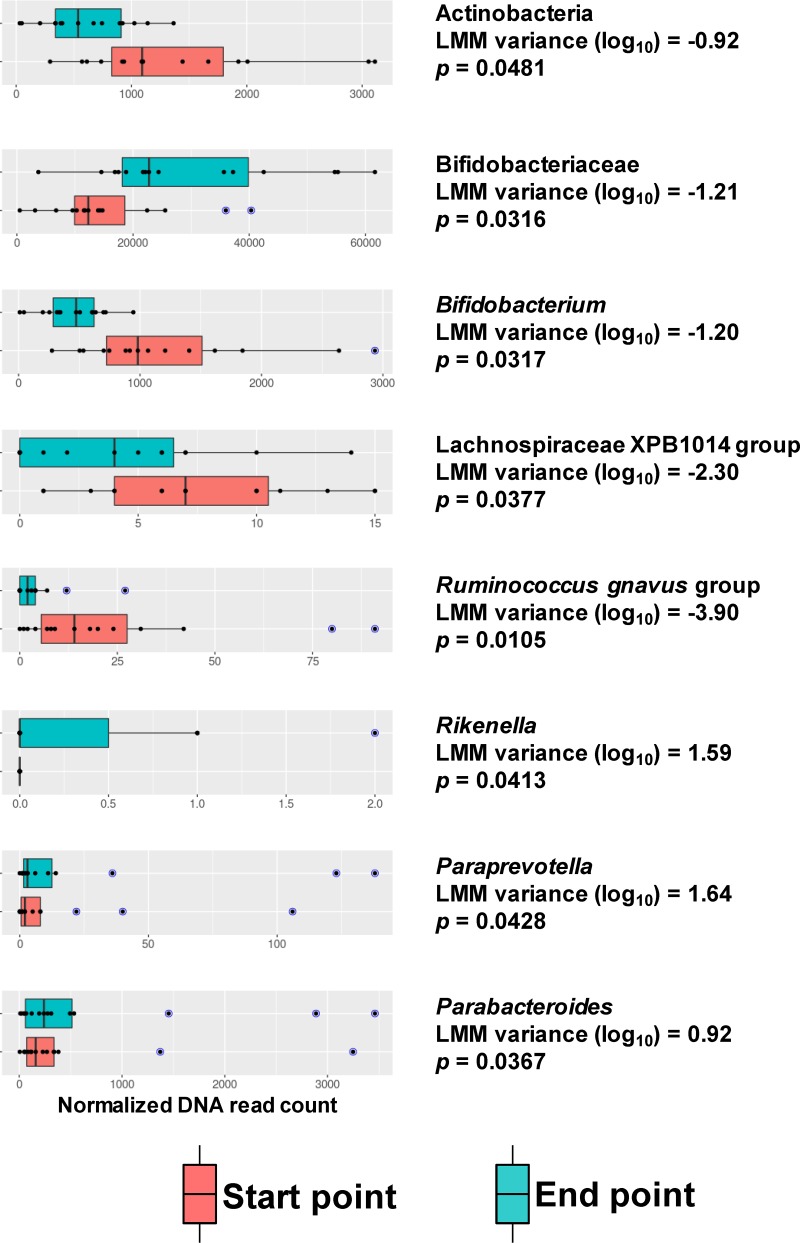
FIG 2.
Gut microbiota components influenced by AXOS intake. The distribution of normalized reads belonging to the taxonomy categories with differential abundance after AXOS consumption is depicted in box plots. Red boxes represent start point samples (baseline before the intervention), whereas turquoise boxes represent the endpoint samples (at the end of the intervention). Blue data points indicate outliers. The linear mixed model (LMM) estimate (baseline as reference group) and P values are shown. LMM indicates the variance obtained using log-transformed data.

