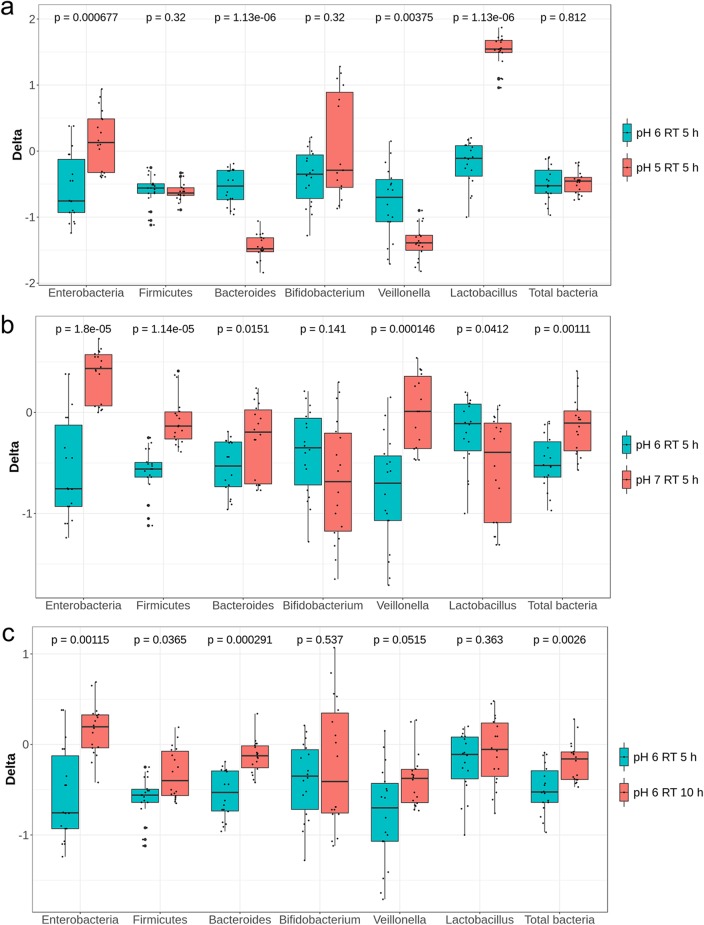
FIG 3.
Effect of pH (a and b) and retention time (RT) (c) on levels of specific bacterial groups enumerated by qPCR using data from both fermentations. Values are expressed as differences (delta) of log10 16S rRNA gene copy numbers of specific bacterial groups enumerated by qPCR between treatment and previous stabilization period within each reactor.

