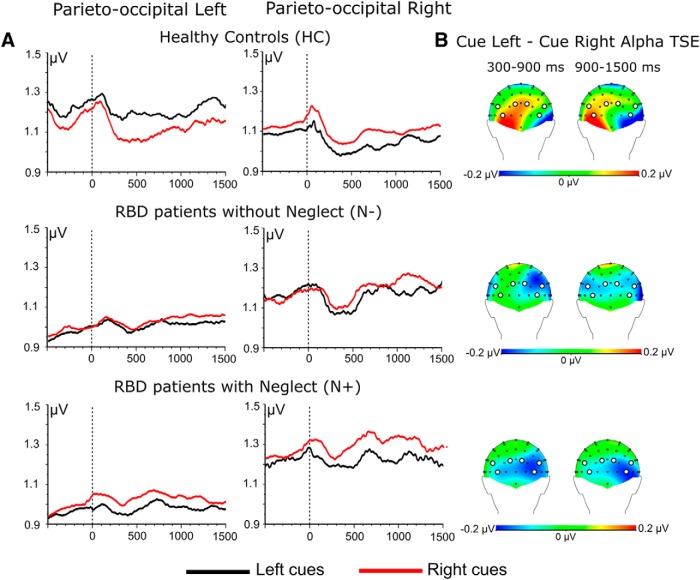
Figure 2.
A, Time course of grand-averaged alpha-band oscillatory activity (TSE) recorded as a function of cue direction (left cue, right cue) in the three experimental groups (HCs, N− patients, and N+ patients). In HCs, differences in TSE between left cues and right cues recorded ahead of cue onset are not significant (see Results). B, Topographical maps of alpha power differences (attend-left − attend-right) averaged across 300–900 ms and 900–1500 ms postcue onsets. White circles on scalp topographies highlight pooled derivations in each hemisphere.

