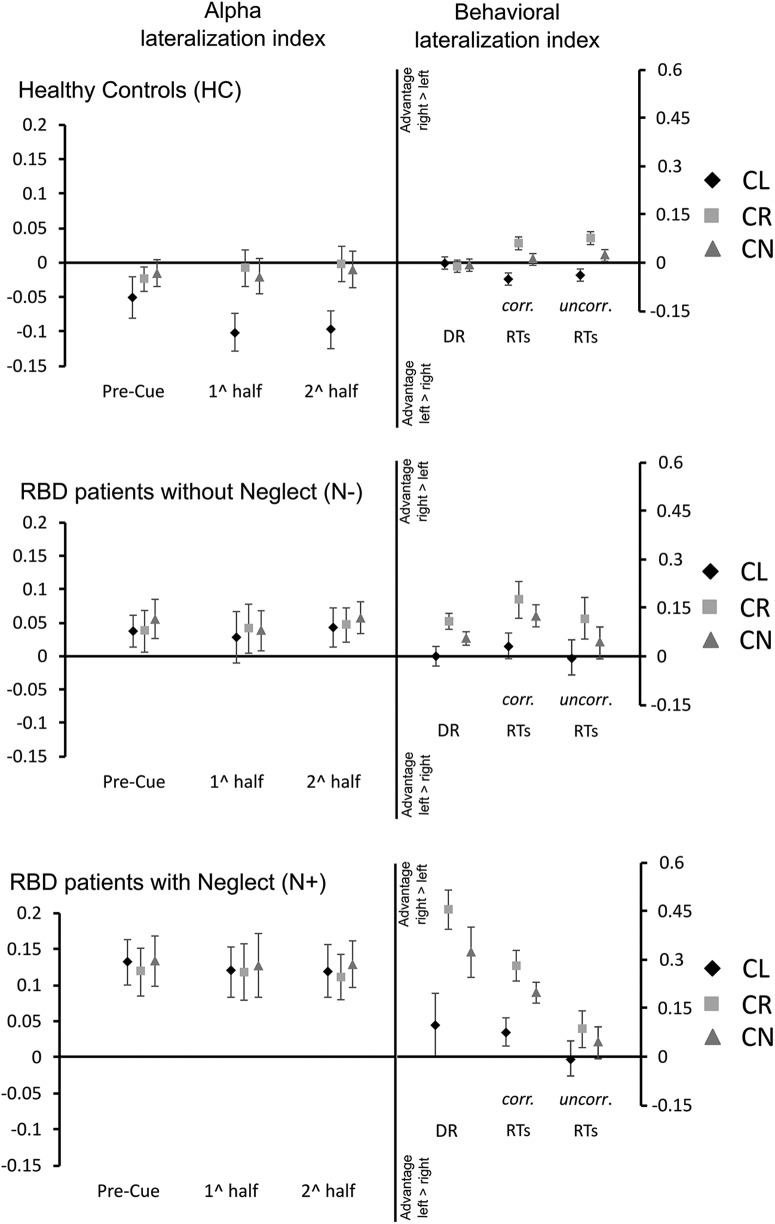
Figure 4.
Hemispheric lateralization index of alpha activity (left vs right hemisphere) and behavioral lateralization index in target processing (left vs right hemispace). Data are reported separately for HCs, N− patients, and N+ patients. For all experimental groups, panels on the left side show the evolution of alpha-lateralization along the baseline-fixation period, the first and the second half of cue presentation. Positive values in the alpha index indicate the higher alpha power over the right hemisphere, and negative values indicate the higher alpha power over the left hemisphere. Panels on the right side represent asymmetries in DRs and RTs between targets presented on the left and the right side of space. Positive values indicate better performance with targets on the right side of space, and negative values indicate better performance with targets on the left side. For RTs, the figure reports both uncorr indices calculated by considering only hits and corr indices that were calculated by replacing misses with the maximal time allowed for response (i.e., 2000 ms). Bars indicate SE. CL, Left cue; CN, neutral cue; CR, right cue.

