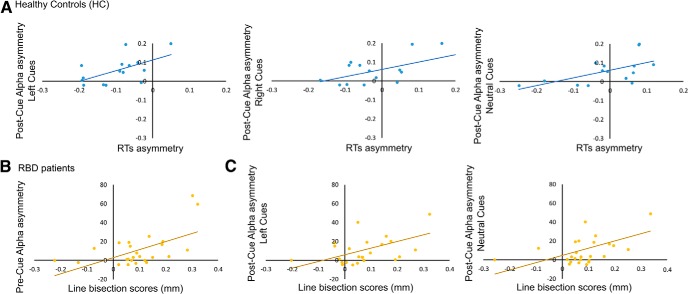
Figure 5.
A, Scatterplots of significant correlations between alpha interhemispheric asymmetries and asymmetries in RTs in HCs during the cue period. Positive alpha values indicate higher alpha power over the right hemisphere, and positive RT values indicate faster responses to targets on the right side of space. B, Scatterplots of significant correlations between alpha interhemispheric asymmetries during the baseline-fixation period (Pre-Cue) and line bisection performance (in mm) in the entire sample of RBD patients (i.e., N+ and N− patients together). C, Scatterplots of significant correlations between alpha interhemispheric asymmetries during the cue period (Post-Cue) and line bisection performance (in mm) in the entire sample of RBD patients (i.e., N+ and N− patients together). Positive values in line bisection scores indicate rightward deviation from the true line center.

