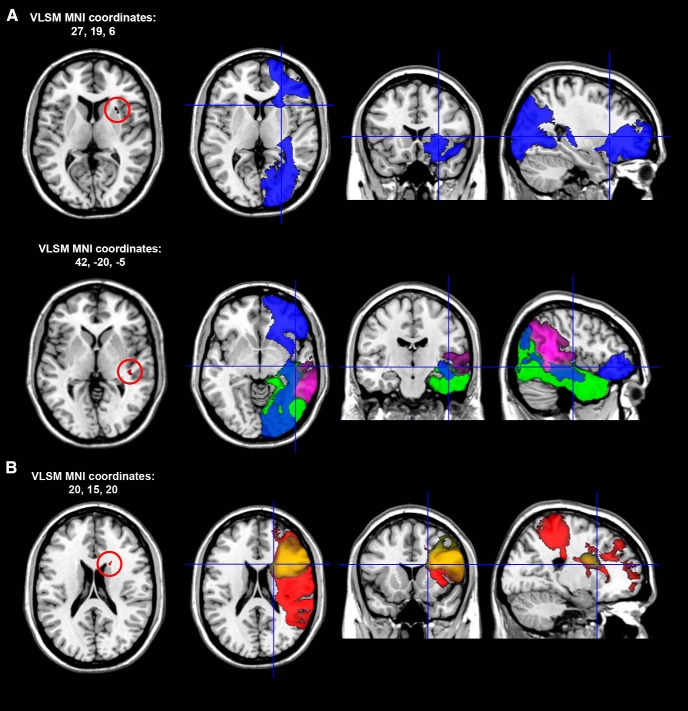
Figure 6.
A, Representative slices showing the anatomical correlates of hemispheric lateralization in alpha oscillatory activity recorded during the presentation of bidirectional neutral cues in the entire sample of RBD patients. The localization of the anterior lesion peak (A, top row) and posterior peak (A, bottom row) is defined in MNI coordinates. The first map on the left of each row shows Z statistics calculated with Brunner–Munzel rank order statistics with permutation-derived correction (Brunner and Munzel, 2000; Medina et al., 2010). All peaks are significant at the p < 0.05 level. In each row, the second, third, and fourth slice show the localization of VLSM anatomical peaks in white matter pathways according to the atlas by Catani and Thiebaut De Schotten (2012): blue, IFOF; green, ILF; purple, posterior segment of the arcuate fasciculus. B, Anatomical correlates of hemispheric lateralization in alpha oscillatory activity recorded during the presentation of cues pointing to the left side of space: red (SLF III), yellow (frontal inferior longitudinal fasciculus).

