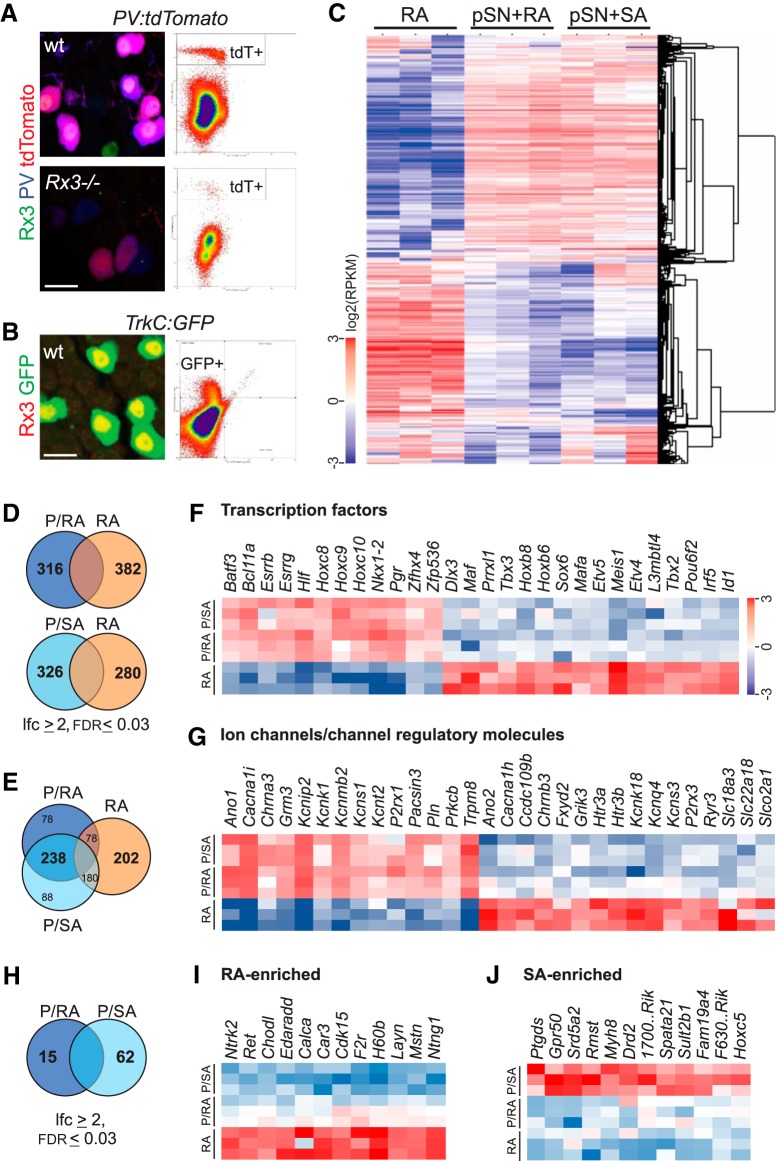
Figure 2.
Molecular genetic strategy to identify proprioceptor selective molecular markers. A, Expression of Runx3, PV, and tdT in p0 DRG in Rx3+/+;PV:Cre;Ai9:tdTomato (Rx3+/+;PV:tdTomato) (wt) and Rx3−/−;PV:tdTomato mice (Rx3−/−) and profiles of FACS-isolated tdT+ neurons from animals with identical genotypes. B, Expression of Runx3 and GFP in p0 DRG of TrkC:GFP mice and profile of FACS-isolated GFP+ neurons from mice with similar genotype. C, Relative transcript levels in RA, pSN+RA and pSNA+SA mechanoreceptor populations. The heatmap shows log2 (RPKM) values with the mean expression across samples subtracted. Hierarchical clustering (Eisen et al., 1998) of genes and samples were performed using the subset of 1091 genes filtered by abundance (RPKM ≥ 5 in ≥ 3 samples) and variation (SD ≥ 0.6 in the log2 scale). D, Venn diagrams of upregulated transcripts comparing the pSN+RA (P/RA) and RA only (RA) neuronal cohorts (top), and comparing pSN+SA (P/SA) and RA only cohorts (bottom). E, Venn diagram of upregulated transcripts shared between the pSN+RA (P/RA) and pSN+SA (P/SA) cohorts compared with RA only (RA) neurons. F, Heatmap of transcription factors differentially expressed between pSN+RA (P/RA), pSN+SA (P/SA), and RA only (RA) mechanoreceptor populations (|log2 (fold change)| ≥ 2; FDR ≤ 0.03). Color scale represents log2 (RPKM) values with mean values subtracted. G, Heatmap of ion channels and regulatory channel molecules differentially expressed between pSN+RA (P/RA), pSN+SA (P/SA), and RA only (RA) mechanoreceptor populations (|log2 (fold change)| ≥ 2; FDR ≤ 0.03). Color scale as in F. H, Venn diagram of differentially expressed transcripts between the pSN+RA (P/RA) and pSN+SA (P/SA) cohorts. I, Heatmap of select transcripts differentially upregulated in the RA only (RA) mechanoreceptor population compared with both pSN+RA and pSN+SA populations (|log2 (fold change)| ≥ 2; FDR ≤ 0.03). Color scale as in F. J, Heatmap of select transcripts differentially upregulated in the pSN+SA only (P/SA) mechanoreceptor population compared with the pSN+RA and RA only populations (|log2 (fold change)| ≥ 2; FDR ≤ 0.03). Color scale as in F. 1700..Rik, 1700123O21Rik; F630..Rik, F630111L10Rik. Scale bars: A, B, 10 μm.

