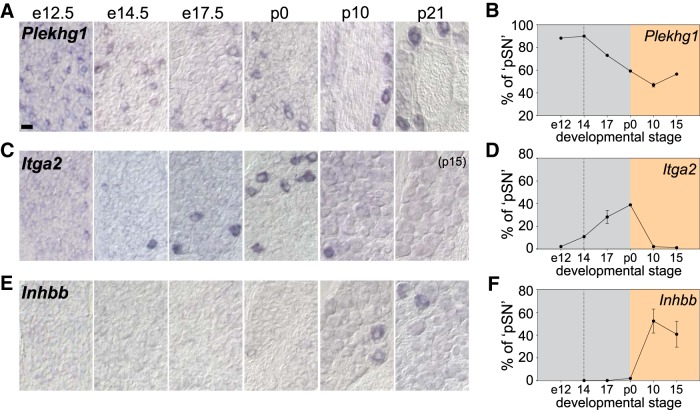
Figure 4.
Expression of newly identified pSN markers across pSN development. A–C, Expression of Plekhg1 (A), Itga2 (B), and Inhbb (C) in embryonic (e12.5, e14.5, e17.5) and postnatal (p0, p10, p21) DRG. D–F, Mean percentage of pSNs that express Plekhg1 (D), Itga2 (E), or Inhbb (F) at different developmental stages. Number of pSN neurons is approximated based on the number of PV+ or Rx3+ neurons in neighboring tissue sections (see Materials and Methods). Plekhg1: e12.5, n = 5 sections, 164 neurons total; e14.5, n = 7, 68 neurons; e17.5, n = 6, 129 neurons; p0, n = 10, 136 neurons; p8–10, n = 12, 59 neurons; p15, n = 20, 137 neurons. Itga2: e12.5, n = 5 sections, 4 neurons total; e14.5, n = 8, 11 neurons; e17.5, n = 20, 129 neurons; p0, n = 9, 75 neurons; p8–10, n = 7, 5 neurons; p15, n = 7, 1 neuron. Inhbb: e12.5, ND; e14.5, n = 4 sections, 0 neurons total; e17.5, n = 4, 0 neurons; p0, n = 7, 3 neurons; p8–10, n = 29, 153 neurons; p15, n = 10, 45 neurons. Gray area represents embryonic developmental stages. Yellow area represents postnatal period. Dotted line indicates developmental stage when pSN axons first engage with their cognate receptor organs. Error bars indicate SEM for data acquired from multiple experiments. Scale bars: A–C, 20 μm.

