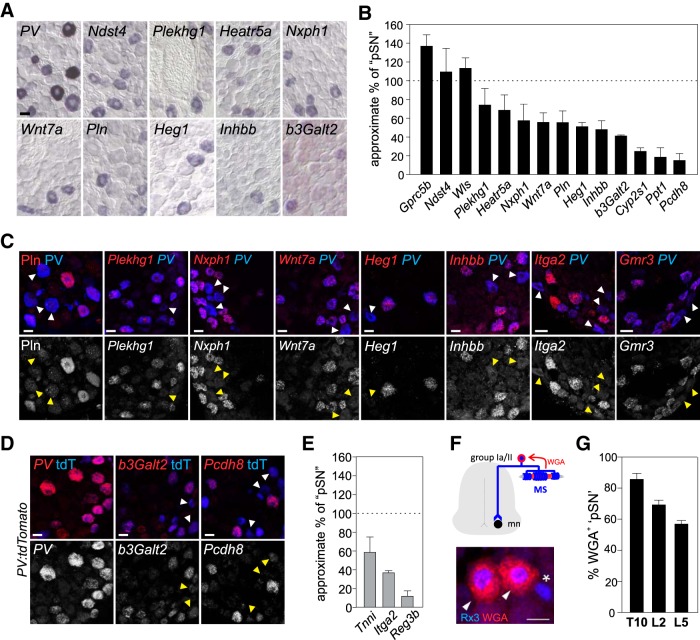
Figure 5.
pSN-enriched transcripts include candidate MS or GTO pSN subtype markers. A, Expression of a sample of pSN-enriched transcripts in p21 WT DRG. B, Mean (± SEM) percentage of pSN neurons expressing an individual pSN-enriched transcript in WT thoracic/rostral lumbar DRG at p15–21. Number of pSN neurons is approximated based on the number of PV+ or Rx3+ neurons in neighboring tissue sections (see Materials and Methods). Quantifications based on DRG sections obtained from at least two experiments and involving a minimum of 5 different animals. Number of sections/total neurons counted: Gprc5b, n = 9 sections, 102 neurons; Ndst4, n = 16, 103 neurons; Wls, n = 13, 134 neurons; Plekhg1, n = 26, 181 neurons; Heatr5a, n = 12, 84 neurons; Nxph1, n = 11, 73 neurons; Wnt7a, n = 26, 175 neurons; Pln, n = 21, 98 neurons; Heg1, n = 25, 127 neurons; Inhbb, n = 18, 95 neurons; b3Galt2, n = 82, 246 neurons; Cyp2s1, n = 14, 43 neurons; Ppt1, n = 18, 54 neurons; Pcdh8, n = 10, 13 neurons. Transcripts not included in analysis are omitted either because of increased expression outside the pSN population (Cacna1i, Clec2l) or because of overall lower expression levels (Mctp2, Pygm, Rhbdl3, Mtfp1, Gmr3). C, D, Colocalization of candidate pSN subset markers with PV protein, PV transcript (C), or genetic reporter expression (PV:tdTomato) (D). With exception of Pln (in C), expression of pSN-enriched transcripts was examined using RNAscope. Probe selection was based on availability. Top, White arrowheads indicate PV neurons devoid of marker expression. Bottom, Yellow arrowheads indicate corresponding neurons. D, Expression of PV is generally in agreement with PV:tdTomato reporter expression, but few PVofftdT+ and PV+tdToff neurons can be observed. E, Mean (± SEM) percentage of pSN neurons expressing Tnni, Itga2, or Reg3b in WT thoracic/rostral lumbar DRG at e18.5-p0. Number of pSN neurons is approximated based on the number of PV+ or Rx3+ neurons in neighboring tissue sections (see Materials and Methods). Quantifications based on DRG sections obtained from at least 2 experiments and involving a minimum of 8 different animals (Tnni, n = 23 sections, 125 neurons; Itga2, n = 19 sections, 138 neurons; Reg3b, n = 24 sections, 60 neurons). F, Genetic strategy to identify MS-innervating pSNs using Egr3:WGA transgenic mice (de Nooij et al., 2013). Expression of WGA in intrafusal muscle fibers labels Rx3+ MS-innervating pSNs (arrowheads) but not presumptive Rx3+ GTO afferents (asterisk). G, Estimated mean (± SEM) percentage of MS and GTO-innervating pSNs on the basis of WGA-labeled pSNs in T10 (n = 3), L2 (n = 6), and L5 (n = 6) DRG, in p8–12 Egr3:WGA mice. Scale bars: A, C, D, 20 μm.

