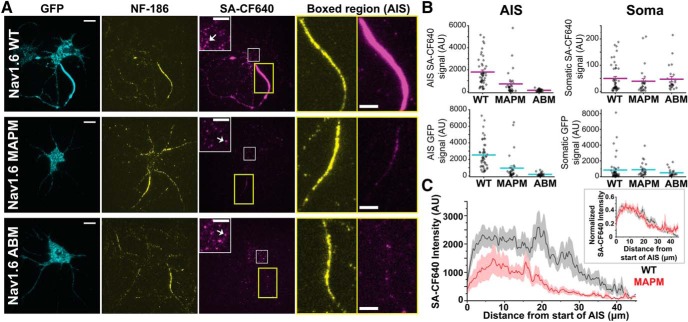
Figure 2.
Nav1.6 MAPM is not concentrated at the AIS but effectively localizes to the soma. A, Representative TIRF images of rHNs (DIV 10) expressing Nav1.6-LoopBAD-GFP WT, MAPM, or ABM (top, middle, or bottom row, respectively). The GFP fluorescence is shown in the first column (cyan), anti-neurofascin (NF)-186 immunostaining in the second column (yellow), and surface labeling in the third column (magenta). Insets in the third column represent enlargements of the somatic surface expression of Nav1.6 corresponding to the white squares. White arrows point to somatic nanoclusters which are stable domains containing multiple Nav1.6 channels (Akin et al., 2016). Two right-hand panels represent enlargements of the NF-186 immunolabeling and surface Nav1.6 expression in AIS (yellow rectangles). Scale bars: Full-size, 10 μm; Enlargements, 5 μm. B, Scatter plots summarizing mean surface labeling signal (SA-CF640, top row, magenta) or mean GFP fluorescence (bottom row, cyan) in the AIS (left) or somatic compartment (right). Lines indicate mean values ± SEM. Nav1.6 MAPM presented significantly less AIS surface labeling and AIS GFP signal than WT, similar to the ABM. There were no significant differences in the somatic compartment, with both mutants showing expression levels similar to the WT. For the GFP AIS signal: 2526.2 ± 239.1 AU, 947.4 ± 279.3 AU, and 195.3 ± 34.7 AU for the WT, MAPM, and ABM, respectively. For the GFP somatic signal: 835.8 ± 224.6 AU, 880.5 ± 163.5 AU, and 486.2 ± 93.2 AU for the WT, MAPM, and ABM, respectively. For the SA-CF640 AIS signal: 1792.1 ± 186.0 AU, 702.1 ± 205.7 AU, and 120.7 ± 18.7 AU for the WT, MAPM, and ABM, respectively. For the SA-CF640 somatic signal: 49.7 ± 7.7 AU, 38.8.4 ± 10.3 AU, and 46.8 ± 10.1 AU for the WT, MAPM, and ABM, respectively. C, Averaged line profile of SA-CF640 intensity along AIS (NF-186 staining was used as a guideline) for WT (black) and MAPM (red) channels. MAPM presents a distribution similar to WT, with smaller values of intensity due to its decreased abundance at the AIS. Line indicates mean values ± SEM. Inset, Normalized SA-CF640 maximum intensity along the AIS, for WT (black) and MAPM (red) channels. Each individual AIS line profile was normalized to its maximal value, and then all line profiles (WT, n = 49; or MAPM, n = 34) were averaged. Because each individual line profile had its maximum value at different position, the averaged normalized line shown does not reach 1 in any specific point.

