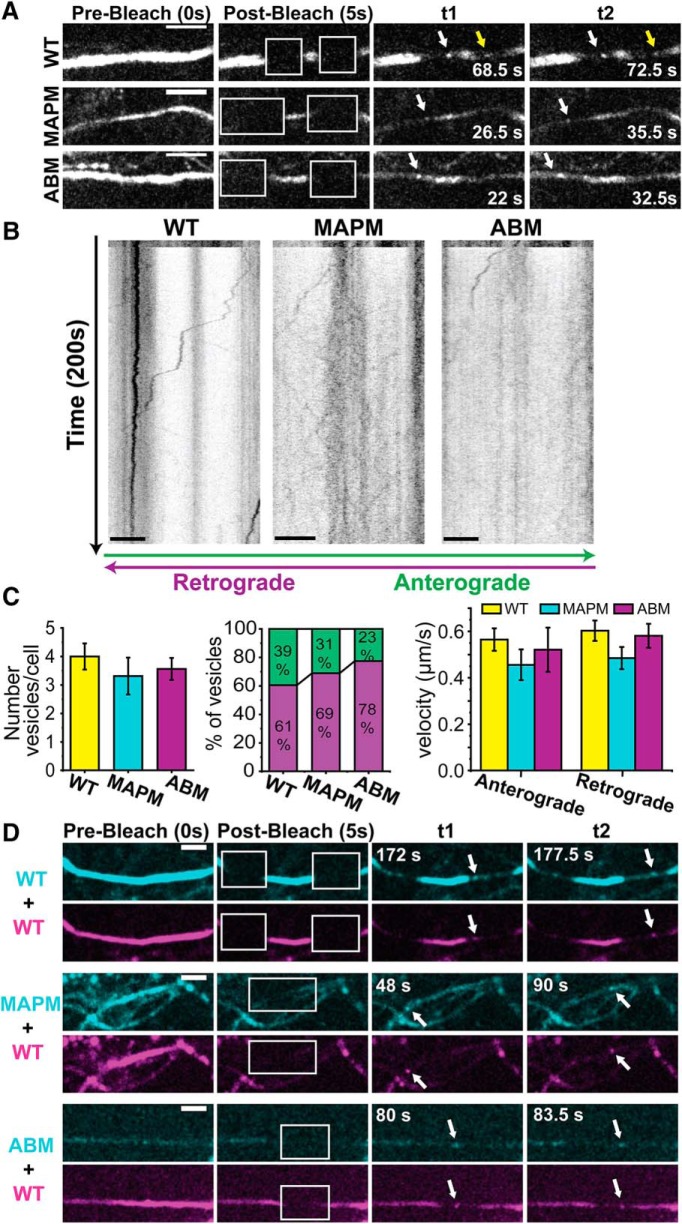
Figure 4.
The lack of MAPM targeting to the AIS is not due to a defect in vesicular packaging or transport to the AIS. Small regions of the AIS in Nav1.6-GFP WT, MAPM, or ABM expressing DIV 6 rHNs were photobleached to visualize vesicles traveling along the axon. A, Axonal trafficking vesicle detection. Shown are different frames of the same movie, where the AIS was bleached (white squares in second column). White arrows point to retrograde vesicles (moving to the left). Yellow arrow points to an anterograde vesicle (moving to the right, from the soma). Scale bars, 5 μm. B, Kymographs from the same processes shown in A. y axis represents time (200 s); the bleach does not happen until 5 s (10 frames) after the movie was initiated. x axis represents position along the AIS. Scale bars, 5 μm. Anterograde vesicles (moving from the soma to the process) are depicted by lines going to the right, and retrograde (trafficking toward the soma) vesicles are depicted by lines moving to the left. C, Average number of vesicles/cell (left graph), distribution of anterograde and retrograde vesicles per cell (middle graph), and average of vesicular transport rate (right graph). No significant differences were found between constructs (4.0 ± 0.46, 3.31 ± 0.65, and 3.56 ± 0.39 vesicles/cell for the WT, MAPM, and ABM constructs). Likewise, there were no differences in transport direction: 60.6 ± 7.7%, 68.9 ± 8.4%, and 77.5 ± 6.6% retrograde vesicles for the WT, MAPM, and ABM, respectively. There were also no differences in the vesicle's velocity between conditions. Error bars indicate SEM. D, MAPM and ABM constructs coexpressed with Nav1.6 WT-mCherry. Images of the GFP (cyan) and the mCherry (magenta) fluorescence at prebleach, 5 s after bleach, and different time points are shown. White arrows point to vesicles carrying WT-mCherry and either WT-GFP (top), MAPM-GFP (middle), or ABM-GFP (bottom). t1 and t2 correspond to different frames 5.5, 42, and 3.5 s apart for WT, MAPM, and ABM coexpression, respectively. Scale bars, 5 μm.

