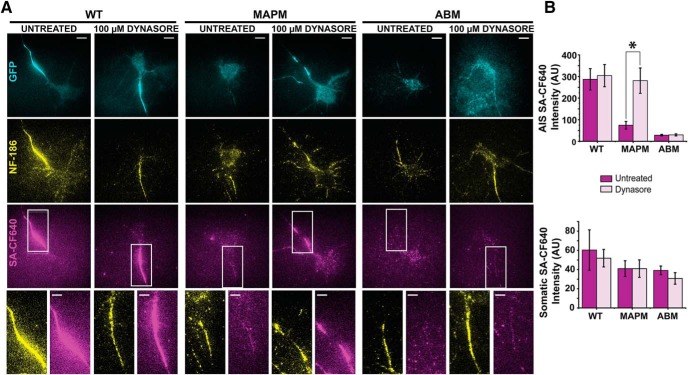
Figure 8.
Nav1.6 MAPM is endocytosed from the AIS compartment. DIV 7 rHNs expressing WT, MAPM, or ABM were incubated with 100 μm Dynasore for 2 h and then surface-labeled and imaged under TIRF conditions. A, Representative images of transfected cells with Nav1.6-LoopBAD-GFP WT (left two panels), MAPM (middle two panels), or ABM (right two panels) untreated (left) or treated with Dynasore (right). Cyan represents GFP signals. Yellow represents axonal neurofascin immunolabeling. Magenta represents surface labeling with SA-CF640. Bottom row represents enlargements of the NF-186 and SA-CF640 signals corresponding to the AIS regions marked with a white rectangle. Scale bars: Full-size, 10 μm; Enlargements, 5 μm. B, Mean SA-CF640 fluorescence in AIS and somatic compartments under the different conditions. Dark color represents untreated. Light color represents Dynasore treatment. Error bars indicate mean ± SEM. *Significance. For the mean SA-CF640 AIS signal: 287.0 ± 49.4.1 AU for WTUntreated, 304.1 ± 51.2 AU for WTDynasore, 74.2 ± 17.7 AU for MAPMUntreated and 280.8 ± 58.7 AU for MAPMDynasore, 25.9 ± 5.4 AU for ABMUntreated and 33.1 ± 5.3 AU for ABMDynasore. For the mean SA-CF640 soma signal: 60.33 ± 21.0 AU for WTUntreated, 51.8 ± 9.1 AU for WTDynasore, 41.0 ± 8.2 AU for MAPMUntreated and 41.0 ± 9.1 AU for MAPMDynasore, 38.6 ± 7.2 AU for ABMUntreated, and 33.5 ± 6.9 AU for ABMDynasore.

