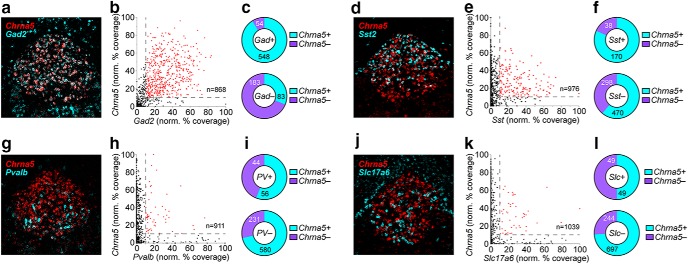
Figure 7.
nAChR expression in rostral IPN neurons. a, Representative FISH image of Chrna5 and Gad2 FISH signals in IPR. b, Scatterplot of Gad2 (abscissa) vs Chrna5 (ordinate) % coverage for all nuclei in IPR FISH images (these data are from the same experiment shown in Fig. 6e). c, Pie graph of Gad2+ and Gad2− nuclei showing fraction of Chrna5+ and Chrna5− nuclei. d, Representative FISH image of Chrna5 and SstFISH signals in IPR. e, Scatterplot of Sst (abscissa) vs Chrna5 (ordinate) % coverage for all nuclei in IPR FISH images (n = 3 male mice). f, Pie graph of Sst+ and Sst− nuclei showing fraction of Chrna5+ and Chrna5− nuclei. g, Representative FISH image of Chrna5 and Pvalb FISH signals in IPR. h, Scatterplot of Pvalb (abscissa) vs Chrna5 (ordinate) % coverage for all nuclei in IPR FISH images (n = 3 male mice). i, Pie graph of Pvalb+ and Pvalb− nuclei showing fraction of Chrna5+ and Chrna5− nuclei. j, Representative FISH image of Chrna5 and Slc17a6 FISH signals in IPR. k, Scatterplot of Slc17a6 (abscissa) vs Chrna5 (ordinate) % coverage for all nuclei in IPR FISH images (n = 3 male mice). l, Pie graph of Slc17a6+ and Slc17a6− nuclei showing fraction of Chrna5+ and Chrna5− nuclei.

