Figure 9.

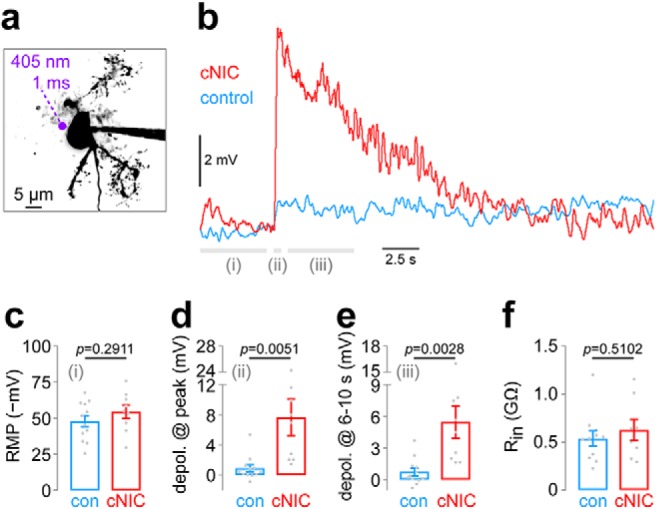
Chronic nicotine enhances IPR neuron excitability. a, Representative IPR neuron and perisomatic photolysis spot location. b, An averaged [control: n = 12 cells, n = 4 mice (2 male/2 female); cNIC: n = 9 cells, n = 6 mice (3 male/3 female)] current-clamp recording trace is shown in IPR neurons from control and cNIC-treated mice. PA-Nic (100 μm) was superfused, and photolysis (1 ms flash, 405 nm, 2 mW) was executed at a perisomatic location. Data from time periods i, ii, and iii are shown in c, d, and e, respectively. c, Summary plot of mean resting membrane potential during time period i (from −5 to −0.5 s before flash onset; see b) is shown for control and cNIC-treated neurons (see b for cell/mouse numbers). p Value, Unpaired t test. d, Summary plot showing the mean membrane potential change during time period ii (from 0.0 to +0.5 s after flash onset; see b) for control and cNIC-treated neurons. p Value, Unpaired t test. e, Summary plot showing the mean membrane potential change during time period iii (from +1.0 to +5.0 s after flash onset; see b) for control and cNIC-treated neurons. p Value, Unpaired t test. f, Summary plot showing input resistance for control and cNIC-treated IPR neurons. See b for cell/mouse numbers. p Value, Unpaired t test.
