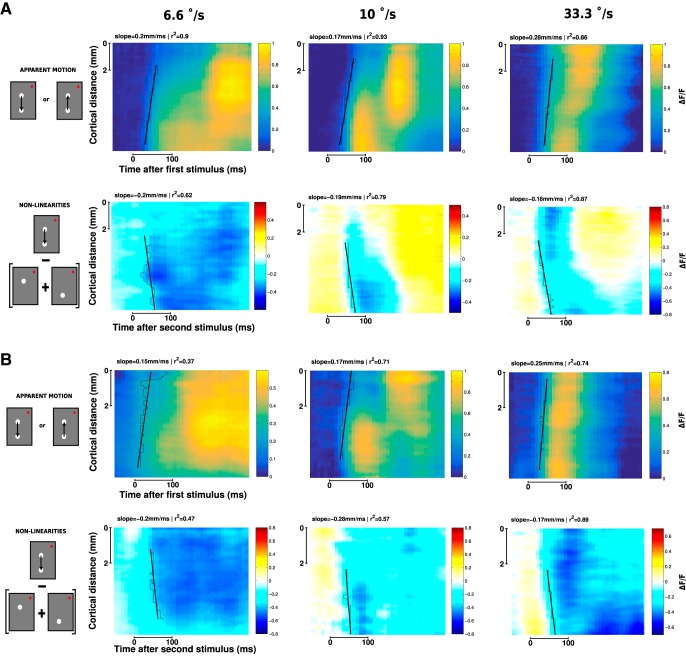
Figure 3.
The apparent motion stimulus induces a systematic suppression wave. ST representation of VSDI responses to two-stroke apparent motion stimuli for three different speeds (6.6, 10, and 33.3°/s separated in 3 columns) and 2 animals: A, Monkey WA; B, Monkey BR. A, B, Top rows represent the observed response. Bottom rows represent the nonlinearities of the response (observed − linear prediction). Estimates of speed propagation are reported on each ST diagram. Black stairs step represents contours at threshold level. Slanting lines indicate the slopes of the linear regressions. Similar speeds are observed for both the observed activity and the nonlinearities.

