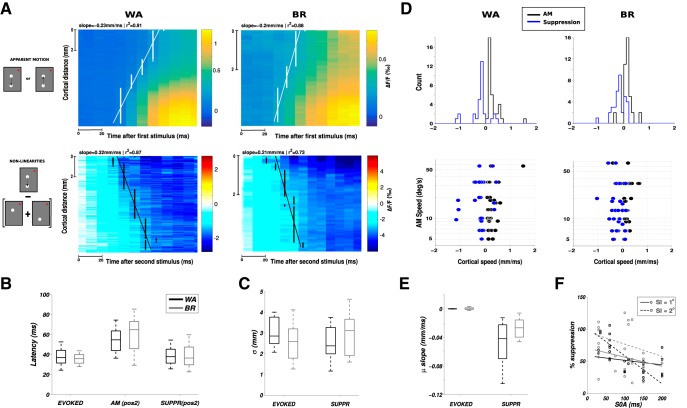
Figure 4.
The suppressive wave has the same properties as the evoked intracortical propagation. A, ST VSDI activity (top row) and nonlinearities (bottom row) averaged across all lrAM speed conditions (n = 30 for Monkey WA and n = 34 for Monkey BR) and centered on stimulus 1 (S1, top row) or stimulus 2 (S2, bottom row) onset, for both monkeys (columns). B, Boxplot of latency estimates comparing the onset of activity evoked by S2 alone (“evoked” condition), the response onset evoked by S2 when embedded in the lrAM sequence (“AM” condition), and the onset of the suppression at S2 position (“suppr” condition). Boxplots represent median, 25% and 75% quartiles, and minimum and maximum of the distributions across all lrAM speed conditions, for the 2 monkeys (black represents Monkey WA; gray represents Monkey BR). C, Boxplot of space constants (parameter σ of a Gaussian spatial fit) comparing the evoked response and the suppression, for the 2 monkeys. D, For each condition in both monkeys (columns), we estimated the speed of propagation of the VSDI (black) and the nonlinearity (blue). Top row represents frequency histograms, values are positive when the direction of the propagation is the same as the direction of the apparent motion, negative otherwise. Bottom row represents these speeds as a function of the speed of the lrAM stimulus. E, Boxplot of the response peak propagation speed (slope of the linear regression on the parameter μ of a Gaussian spatial fit) comparing the evoked response and the suppression, for both monkeys. F, Suppression strength (normalized to the maximal response activity) as a function of stimulus onset asynchrony and SI (open circle represents SI = 1°; open square represents SI = 2°), for both monkeys: black represents Monkey WA; gray represents Monkey BR. Linear regressions are also plotted: solid lines indicate SI = 1°; dashed lines indicate SI = 2°.

