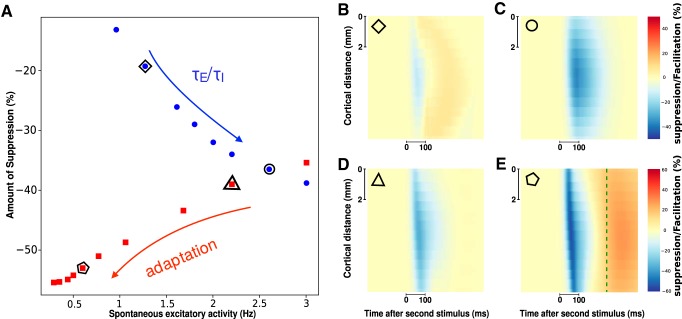
Figure 6.
The effect of spike-frequency adaptation on the suppressive wave. A, Maximum of wave suppression (across space and time) for different values of adaptation strength b (dynamic adaptation model, red squares) and ratio between excitatory and inhibitory synaptic time scales (static adaptation model, blue dots). The values of b range from 0 to 100 pA, and the values of τE range from 3 to 9 ms (while τI = 5 ms); both arrows point to an increase in the values of b and τE. On the x axes, we report the corresponding value of spontaneous excitatory firing rate. B–E, Suppressive wave for four parameter values (see associated symbols in A). E, Dashed green line indicates the beginning of the hyperpolarization period of the model response due to adaptation. The excitatory external drive is rdrive = 3.5 Hz for blue dots (b = 80 pA) and rdrive = 1.2 Hz for red squares (τE = τI = 5 ms), and the amplitude of the input is A = 10 Hz for both blue dots and red squares.

