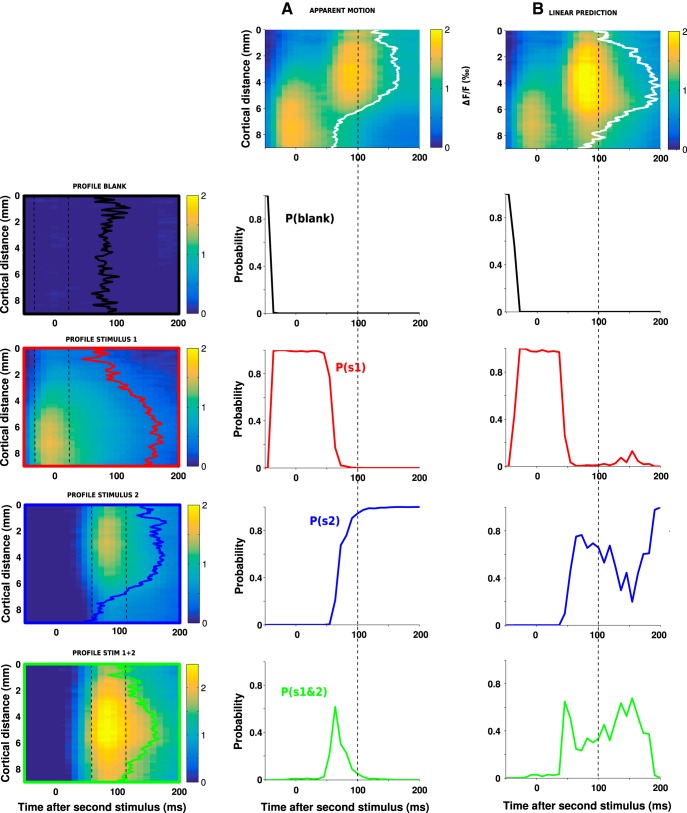
Figure 7.
A dynamic decoding of stimulus position: principle. The decoding of stimulus position on ST maps, here taking the example of the activity evoked by a 6.6°/s lrAM stimulus shown in A or the activity pattern predicted by the linear combination in space and time of the responses to both individual stimuli in B. The decoding consists of evaluating the probabilities that the spatial profile observed at each point in time (A,B, white contours) is similar to one of the four spatial profiles shown on the left column: Blank (first row, black profile), S1 (second row, red profile), S2 (third row, blue profile), and the joint S1 and S2 (last row, green profile). Each profile was computed by averaging the corresponding ST response in a 50 ms window around the time of maximum response and normalized. The four color-coded probabilities are, respectively, plotted as a function of time: time 0 corresponds to the onset of S2 for the lrAM response (column A) and for the linear prediction (column B). Compared with the linear prediction, the actual signal is more rapidly decoded, revealing a likely function of the suppressive wave: shaping stimulus position representation.

