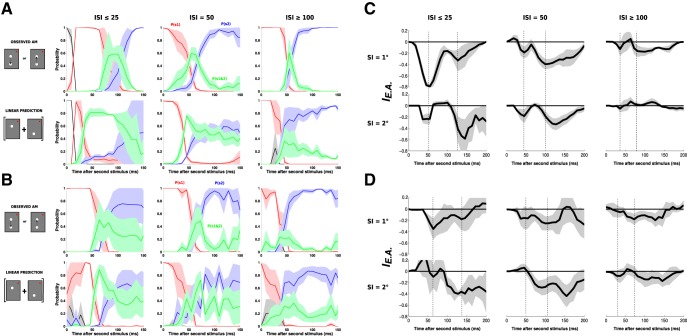
Figure 8.
A dynamic decoding of stimulus position: Application to all lrAM speeds and sessions. A, Color-coded probabilities (same as Fig. 7) for the observed lrAM response (first row) and its corresponding linear prediction (second row) for Monkey WA, averaged across three ISI categories: ISI ≤ 25 ms (left column, n = 2), ISI = 50 (central column, n = 6), and ISI ≥ 100 ms (right column, n = 4). Shaded areas represent SEs across sessions. B, Application of the decoding algorithm to all the data of Monkey BR (n = 4, n = 4, and n = 5 sessions for the three ISIs, respectively). C, Explaining away index (see Materials and Methods) computed as the probability of detecting joint S1 and S2 in the observed response minus the probability of detecting joint S1 and S2 in the linear prediction, from Monkey WA data shown in A. D, Explaining away index from Monkey BR data shown in B.

