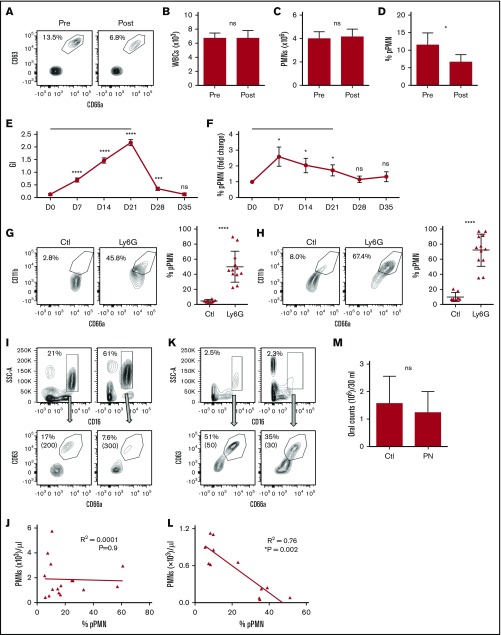
Figure 7.
pPMN levels fluctuate with tissue trauma/inflammation and neutropenia. Blood was obtained from human volunteers prior to (pre) and 15 minutes following (post) gingival probing induced microtrauma (A-D; n = 9). Representative contour plots and pPMN percentages are shown (A). White blood cell counts (WBC) (B), total PMN counts per milliliter of blood (C), and percentage of pPMNs as a fraction of total gated PMNs (D) are shown. Mean values ± SEM are shown. P values were determined by paired Student t test. *P ≤ .05. (E-F) Clinical parameters and blood PMNs were assessed on a weekly basis for volunteers undergoing experimental gingivitis (n = 25). A black horizontal line designates the period of cessation of oral hygiene. GI and blood pPMN percentages were determined weekly from days 0 to 35. Mean values ± SEM are shown. Repeated measures ANOVA was performed with the Fisher's LSD test for multiple comparisons. All comparisons are relative to day 0 (D0). *P ≤ .05; ***P ≤ .0005; ****P ≤ .0001. (G-H) PMNs were depleted in mice by intraperitoneal injection of anti-Ly6G, and pPMN levels in BM (G) and blood (H) were determined 2 to 5 days later. We consistently observed a 90% to 98% depletion of PMNs in BM and blood by anti-Ly6G injection. Representative dot plots are shown for control (Ctl; n = 8) and Ly6G-depleted (Ly6G, n = 12) mice. The mean percentage of pPMNs as a fraction of total PMNs is shown (±SD). A 2-tailed unpaired Student t test was performed. ****P < .0001. (I-L) The percentage of PMNs and pPMNs in healthy controls and pediatric neutropenia patients was determined by flow cytometry. Representative contour plots are shown for 2 healthy controls (I) and 2 neutropenia patients (K). Percentage PMNs and percentage pPMNs are indicated. Absolute pPMN counts per microliter of blood are indicated in parentheses. Linear regression analysis was performed. An inverse correlation between pPMN percentage and PMNs per microliter of blood was observed in the neutropenia cohort (n = 12), whereas no correlation was found in the healthy controls (n = 16). (M) PMN counts from control (Ctl) and pediatric neutropenic patient (PN) oral rinse samples were determined. The 2-tailed Student t test was performed.

