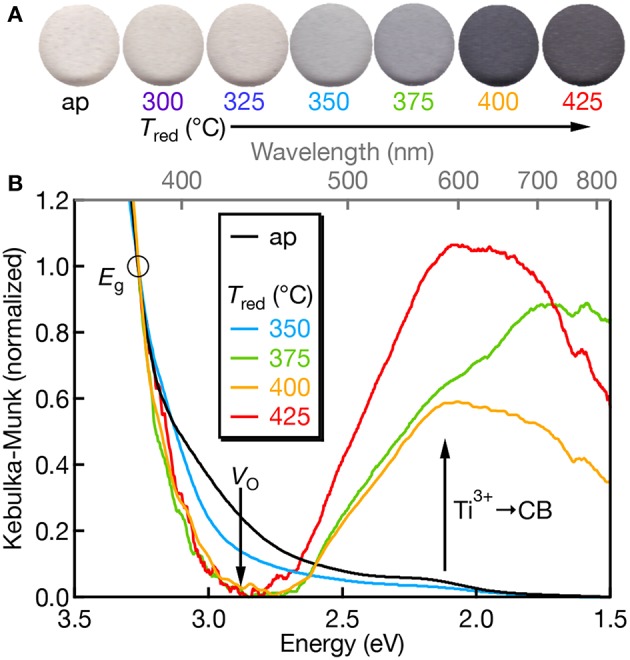
Figure 2.

(A) Scanned color images of Mn:SrTiO3 powders as a function of Tred. (B) Diffuse-reflectance spectra of Mn:SrTiO3 as a function of reduction temperature (as-prepared = black; Tred at 350°C (blue), 375°C (green), 400°C (orange), and 425°C (red), respectively). Data were normalized at 380 nm (3.26 eV; denoted by the circle) after setting the lowest y-value in the spectrum as the “zero.” The Tred = 400°C spectrum was smoothed for presentation.
