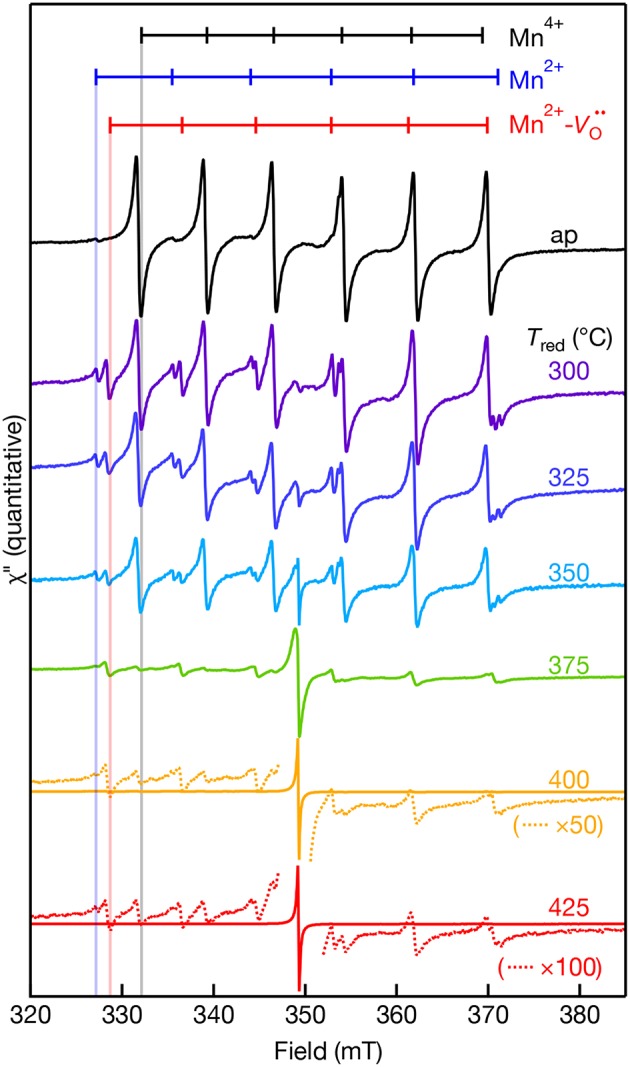
Figure 3.

Room temperature X-band EPR spectra of 0.1% Mn-doped SrTiO3 bulk powder before (as-prepared, black) and after NaBH4 reduction for 30 min at various temperatures (300–425°C). The dotted lines in the 400 and 425°C spectra are selected regions of the spectra that are multiplied (×) by 50 and 100, respectively. The calculated resonance fields for the hyperfine-split transitions of Mn4+ (black), Mn2+- (red), and Mn2+ (blue) in SrTiO3 are shown as vertical markers. The calculated resonance fields were simulated for each Mn center observed in the EPR with EasySpin (see characterization). Data were collected on the same day in a double-resonator cavity equipped with an as-prepared sample in the 2nd resonator and used to standardize sample intensities.
