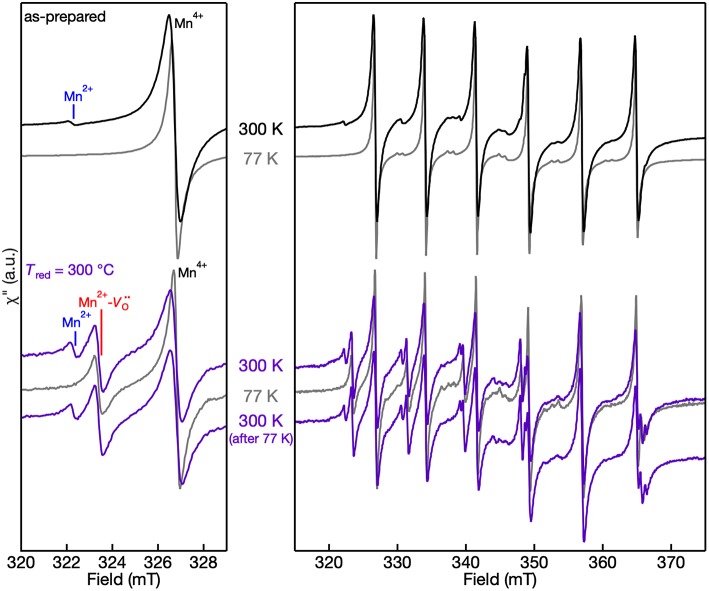
Figure 6.
300 K and 77 K EPR spectra of Mn:SrTiO3 powders as-prepared (top) and after Tred = 300°C (bottom). (left) Spectra in the region of the lowest field transitions within the hyperfine structure and (right) full spectrum. The temperatures at which the spectra were collected are labeled in the figure. Spectra are normalized to account for the increased EPR intensity with decreasing temperature.

