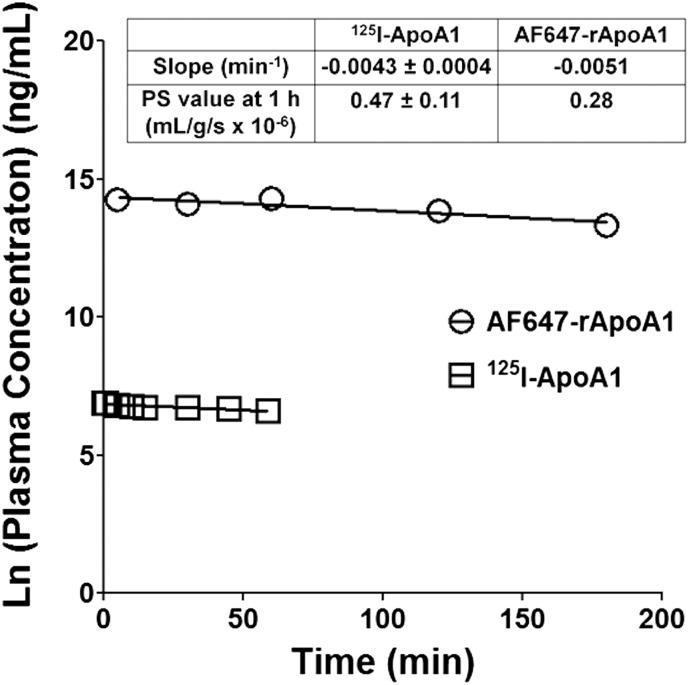
Fig. 2.
Comparison of plasma concentration versus time profiles of 125I-ApoA-I in rats (□) and Alexa Fluor 647-labeled recombinant ApoA-I (AF647-rApoA-I) in mice (○). Mouse data were extracted from a previous study by Stukas et al. (2014a) in which an intravenous bolus of AF647-rApoA-I (60 mg/kg) was injected via the tail vein (n = variable for each data point). Data points from the current study represent mean values (n = 6 for rats). Based on the F-test, the slope values are not significantly different: F(1,9)= 0.1544, P = 0.7035. Slope and PS values for 125I-ApoA-I represent mean ± S.D. (n = 6).

