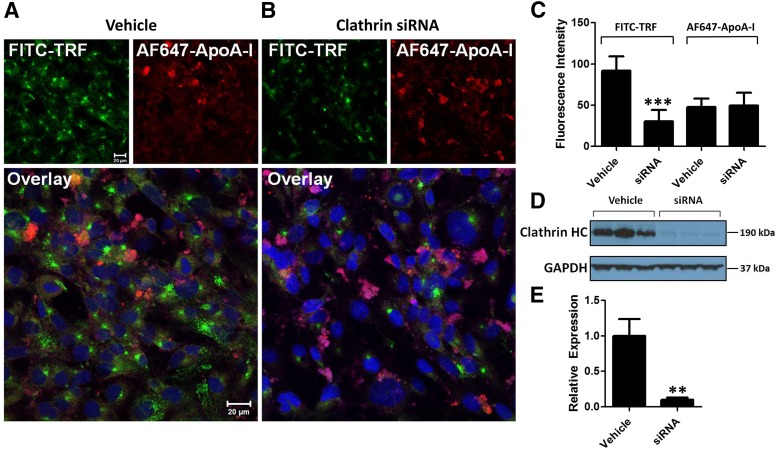
Fig. 5.
Small interfering RNA knockdown of clathrin heavy chain has little effect on AF647-ApoA-I uptake in hCMEC/D3 monolayers. (A) Laser confocal micrographs of hCMEC/D3 transfected with vehicle alone show punctate localization of FITC-TRF, most likely in the endosomes. The images are representative of two independent experiments. (B) The hCMEC/D3 monolayers transfected with clathrin siRNA show greatly reduced uptake of FITC-TRF with little change in intracellular accumulation of AF647-ApoA-I (0.4 µM). All images were processed similarly and obtained using the same instrument settings. Green = FITC-TRF; red = AF647-ApoA-I; blue = DAPI-stained nuclei. Scale bar, 20 µm. (C) Intracellular fluorescence intensities from 25 cells were quantified using ImageJ software and presented as mean ± S.D. (n = 4). Student’s t test showed a significant decrease in FITC-TRF uptake with no change in AF647-ApoA-I uptake in the siRNA transfected cells compared with cells transfected with vehicle alone (P < 0.001). (D) Western blot showing the decrease in expression of clathrin heavy chain (HC) in hCMEC/D3 after siRNA transfection. (E) Semiquantitative analysis by densitometry showing the decrease in clathrin heavy chain expression in the siRNA transfected cells. Values are normalized to vehicle and presented as mean ± S.D. (n = 3). Student’s t test showed a significant decrease in clathrin heavy chain expression for the siRNA transfected cells (**P < 0.01).

