Figure 6.

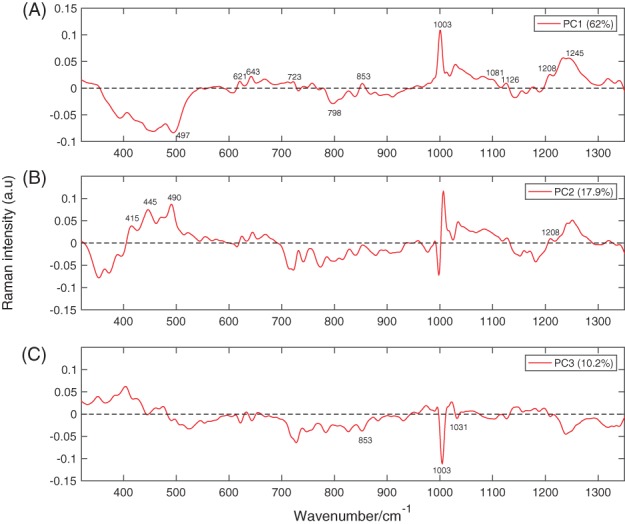
Plots of the first 3 principal components. PC1, PC2 and PC3 account for 62%, 17.9% and 10.2% of the variability in the original data sets, respectively

Plots of the first 3 principal components. PC1, PC2 and PC3 account for 62%, 17.9% and 10.2% of the variability in the original data sets, respectively