Figure 7.

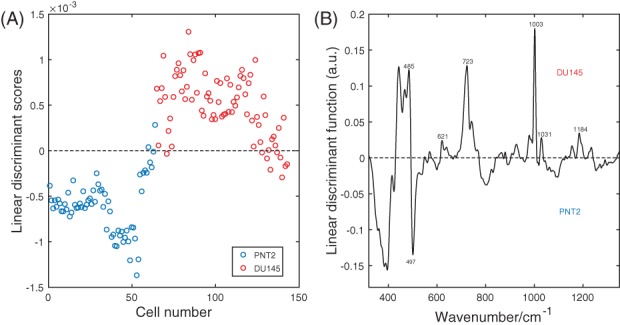
(A) Scatter plot of the linear discriminant scores of PNT2 and DU145 cells spectra using PCA/LDA. (B) Linear discriminant function

(A) Scatter plot of the linear discriminant scores of PNT2 and DU145 cells spectra using PCA/LDA. (B) Linear discriminant function