
Fig. 3.
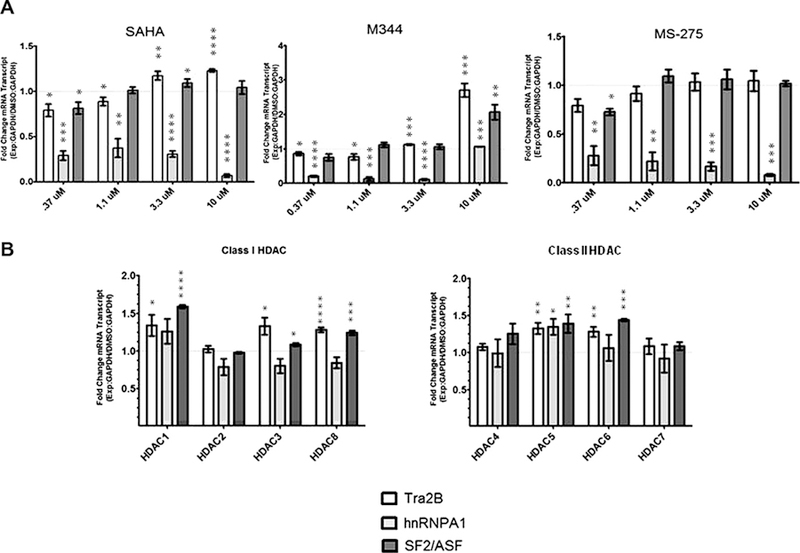
Quantitative PCR of endogenous splicing factors in response to HDAC inhibitor treatment in SMN2-luciferase reporter cells. SMN2-luciferase reporter cells were treated with 4 concentrations of HDAC inhibitors SAHA, M344, and MS-275. mRNA levels of splicing factors hTra2b (white bars), hnRNPA1 (gray bars), and SF2/ASF (dark gray bars). qRT-PCR was used to measure fold changes in transcript levels relative to DMSO carrier treated cells. GAPDH was used for normalization. (B) SMN2-luciferase reporter cells were treated with HDAC specific shRNA. mRNA levels of splicing factors hTra2b (white bars), hnRNPA1 (gray bars), and SF2/ASF (dark gray bars). qRT-PCR was used to measure fold changes in transcript levels relative to a non-silencing shRNA control. GAPDH was used for normalization.