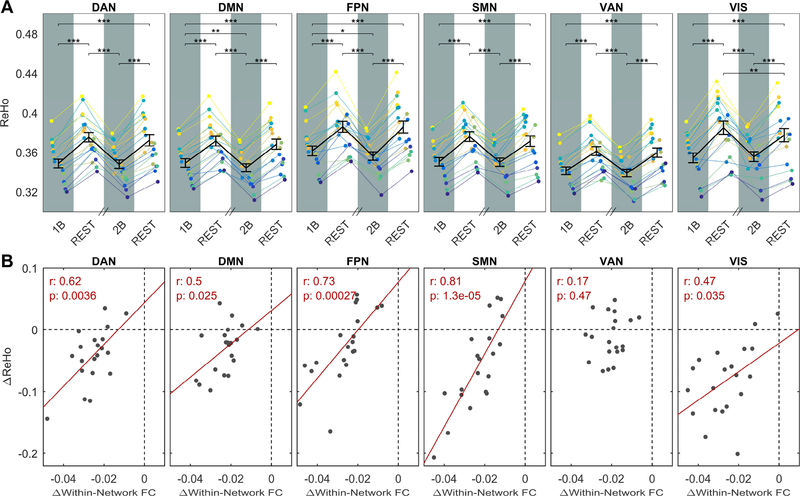
Figure 4: A) ReHo across different steady-state epochs.
Plots show ReHo values averaged in the six ICA-derived networks as a function of the epoch condition (1B, REST, 2B, REST). In each plot, the group-averaged mean and SEM are displayed on top of single subject time-courses. In all networks, ReHo significantly differed among epochs (one-way repeated-measures ANOVA, p-FDR << 10−5) and was reduced by task, as revealed by post-hoc paired t-tests. Significance of t-tests is marked with asterisks: ∗∗∗ p< 0.001, ∗∗ p< 0.01, ∗ p< 0.05. In DMN and FPN the reduction was characterized by a significant effect of load. B) Correlations between ReHo changes and FC changes. Correlation coefficient and p values were reported for each network. The correlation was significant for 5 out of 6 investigated networks.

