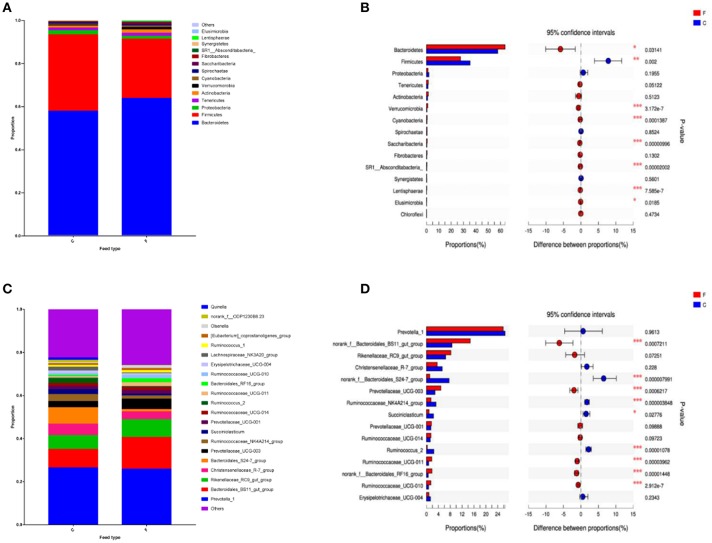
Figure 2.
Classification of the bacterial community composition across the forage and concentrate groups. (A) Phylum level. (B) Extended error bar plot showing the bacteria at the phylum level that had significant differences between the concentrate and forage groups. (C) Genus level. (D) Extended error bar plot showing the bacteria at the genus level that had significant differences between the concentrate and forage groups. Positive differences indicate greater abundance of bacteria at the phylum level and at the genus level in the concentrate group, while negative differences indicate greater abundance in the forage group. C, concentrate group; F, forage group. Asterisks indicate significant difference between the Concentrate Group and the Forage Group (*0.01 < P ≤ 0.05; **0.001 < P ≤ 0.01; ***P ≤ 0.001).

