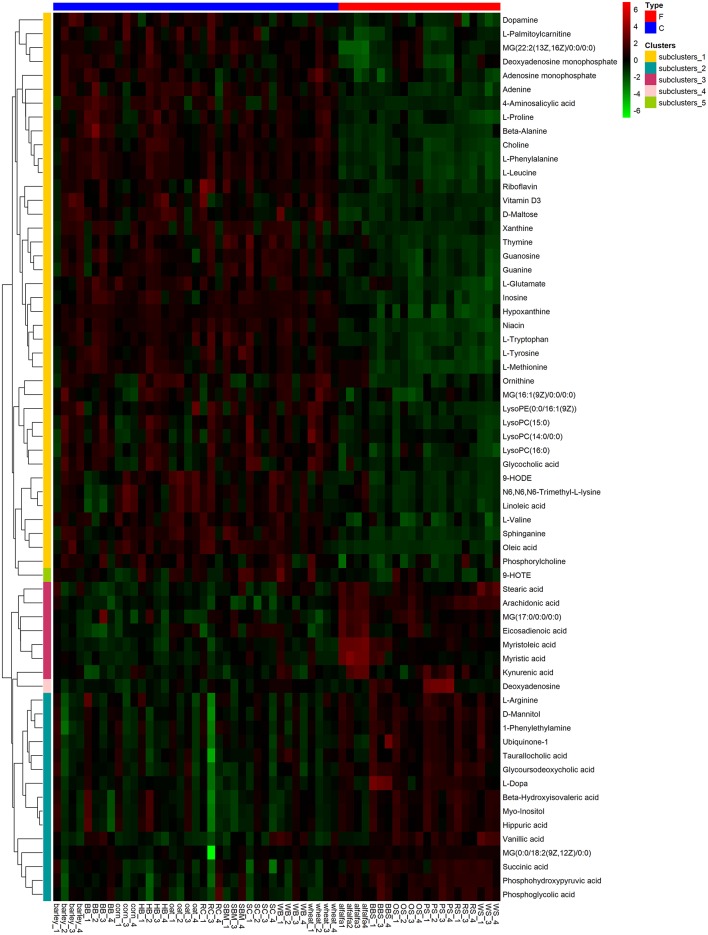
Figure 6.
Hierarchical clustering analysis for identification of different metabolites in yak rumen by comparison of the concentrate and forage groups following positive mode ionization. Each column in the figure represents a sample, each row represents a metabolite, and the color indicates the relative amount of metabolites expressed in the group; Red indicates that the metabolite is expressed at high levels, and green indicates lower expression.

