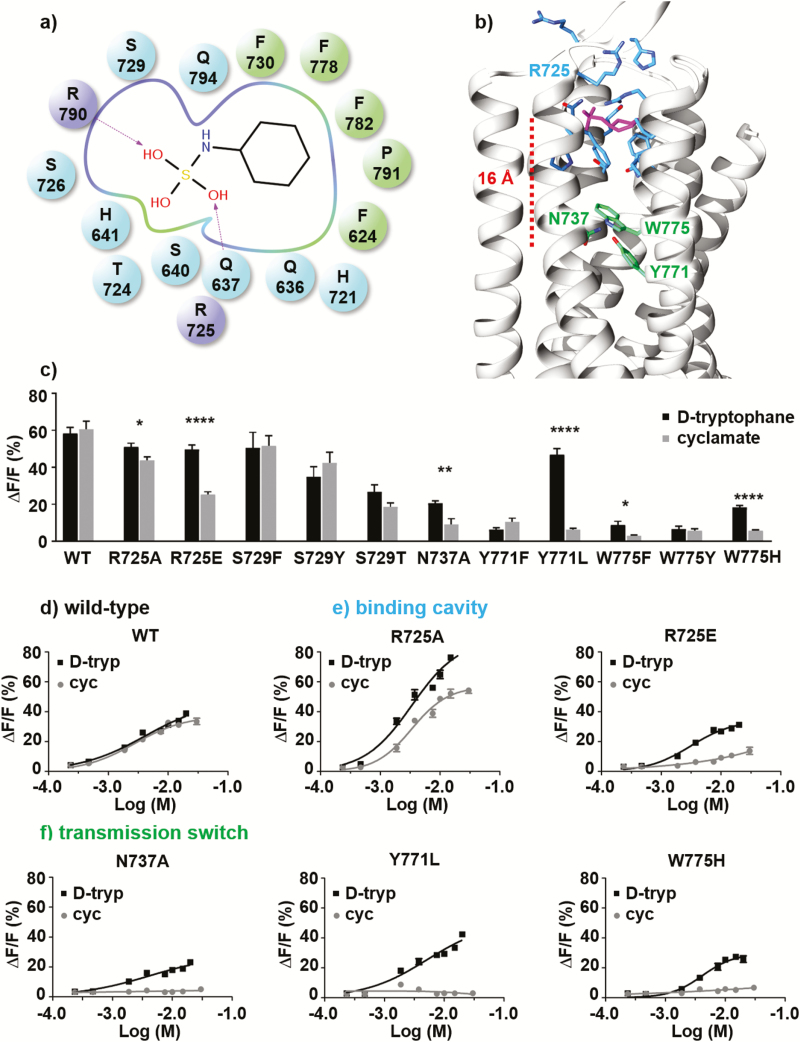
Figure 2.
(a) Schematic representation of the ligand–receptor interactions. Charged (R725ecl2 and R7907.28), polar (Q6363.32, Q6373.33, S6403.36, H6413.37, H721ecl2, S726ecl2, S7295.39, and Q7947.32), and hydrophobic residues (F6242.56, F7305.40, F7786.53, L7826.57, and P7917.29) are represented as purple, blue and green spheres (dark and light grey in the print version), respectively. (b) Representative structure of the cyclamate-bound T1R3 receptor obtained from molecular dynamics simulations. The binding mode is consistent with the best docking solution and recapitulates available experimental data. Residues of the allosteric binding pocket and those involved in the transmission switch are respectively shown as blue and green (light grey in the print version) sticks. (c) Activity of wild-type sweet-taste receptor and single-point mutants of functional residues upon application of 10-mM d-tryptophan (■) and cyclamate (●); each experiment was repeated 3 times. (Statistical significance: *P ≤ 0.05; **P ≤ 0.01; ***P ≤ 0.001; ****P ≤ 0.0001.) (d-f) d-tryptophan (■) and cyclamate (●) dose–response curves obtained for wild-type sweet-taste receptor (d) and single-point mutants of residue R725ecl2 (e), N7375.47, Y7716.46, and W7756.50 (f); each experiment was repeated twice.

