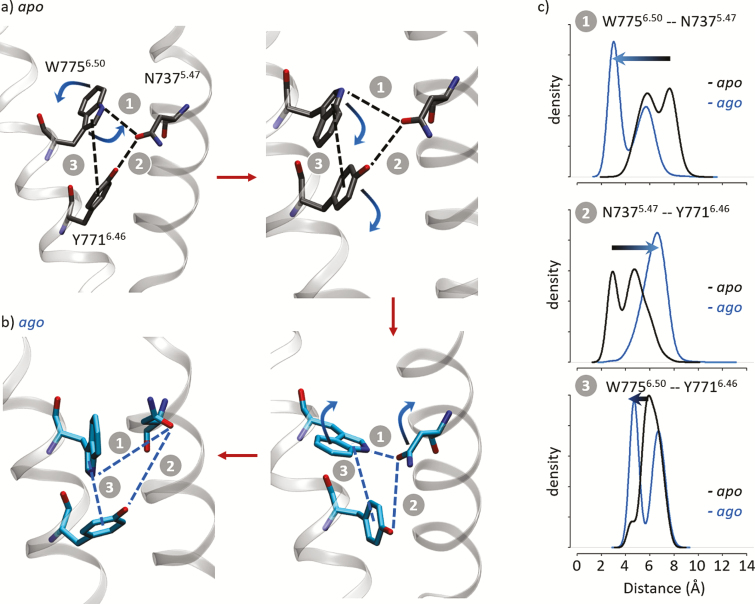
Figure 3.
Structural analysis of the apo (a) and the agonist-bound (b) forms of the T1R3 receptor. Representative structures display the conformations of residues N7375.47, Y7716.46, and W7756.50. Red arrows suggest a putative activation mechanism. (c) Distribution of the inter-residue N7375.47-Y7716.46 and N7375.47-W7756.50 distances (1 and 2). Distribution of the Y7716.46-W7756.50 side-chain center-of-mass distances (3). Distances have been calculated between the Oδ1, Oη, and Nε1 atoms of N7375.47, Y7716.46, and W7756.50, respectively. Y7716.46 center of mass has been calculated considering the aromatic ring including Cε1, Cε2, Cδ1, Cδ2, Cγ, and Cζ atoms. W7756.50 center of mass has been calculated considering the pyrrole ring including Nε1, Cε2, Cδ1, Cδ2, Cγ atoms. See Supplementary Figure 4 for time series plots.

