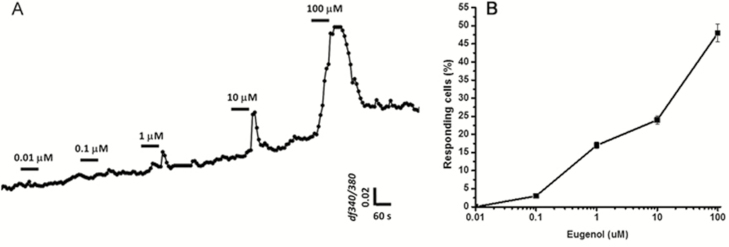
Figure 10.
Concentration-dependent responses to eugenol measured in HBO cells. (A): Increasing eugenol concentrations resulted in concentration-dependent increases in the peak amplitude of intracellular calcium concentration changes. HBO cells (n = 9) were stimulated with eugenol at concentrations of 0.01, 0.1, 1, 10, and 100 μM. Data are shown as fluorescence intensity changes (ΔF340/F380) of 9 different cells combined. (B): Dose–response curve for eugenol. Data are shown as the percentage of responding cells compared with the total number of HBO cells (n = 5 experiments) in the same camera field, indicating that increasing concentrations of eugenol induced increasing numbers of responsive cells.

