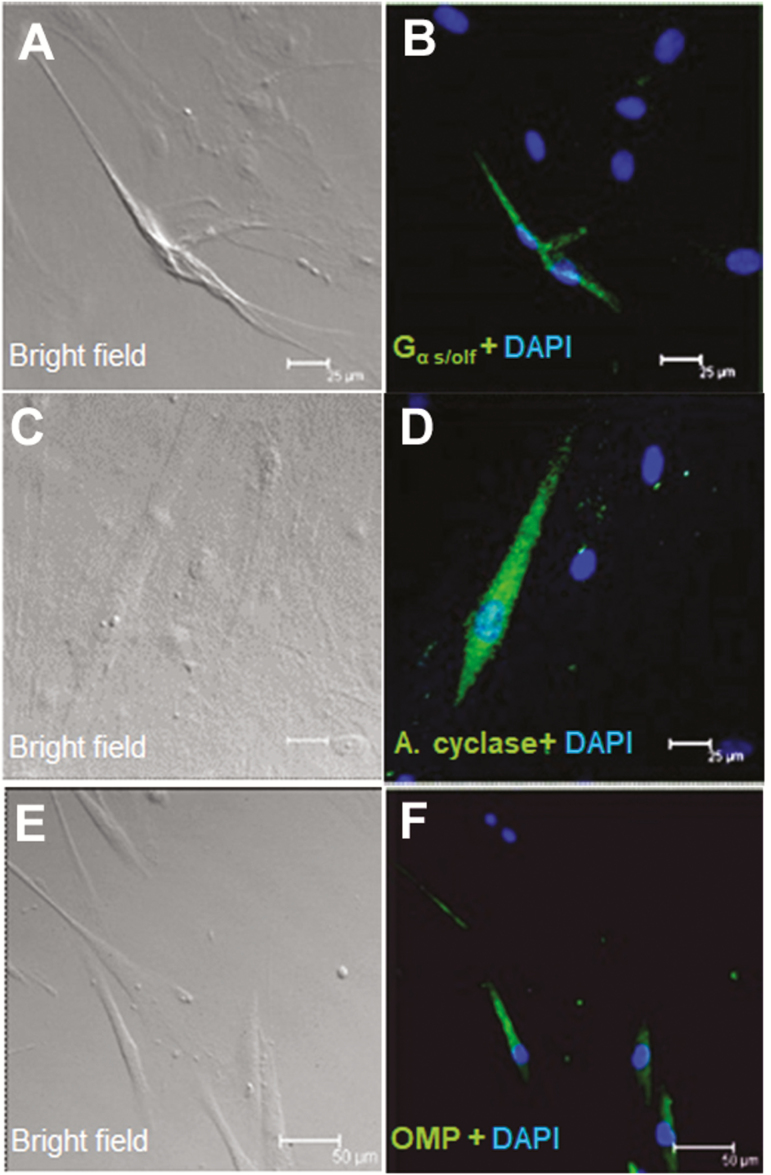
Figure 5.
Immunocytochemical detection of olfactory signal transduction proteins in HBO cells. Brightfield (A, C, and E) and immunofluorescence (B, D, and F) images demonstrate immunoreactivity (green) of Gα s/olf (A and B; n = 15 of 72) in the cytoplasm and membrane and of adenylyl cyclase (C and D; n = 23 of 217) and OMP (E and F n = 13 of 92) in the cytoplasm in a subgroup of HBO cells. Nuclei are stained with DAPI (blue). Scale bars: (A–D) = 25 µm; (E) and (F) = 50 µm.

