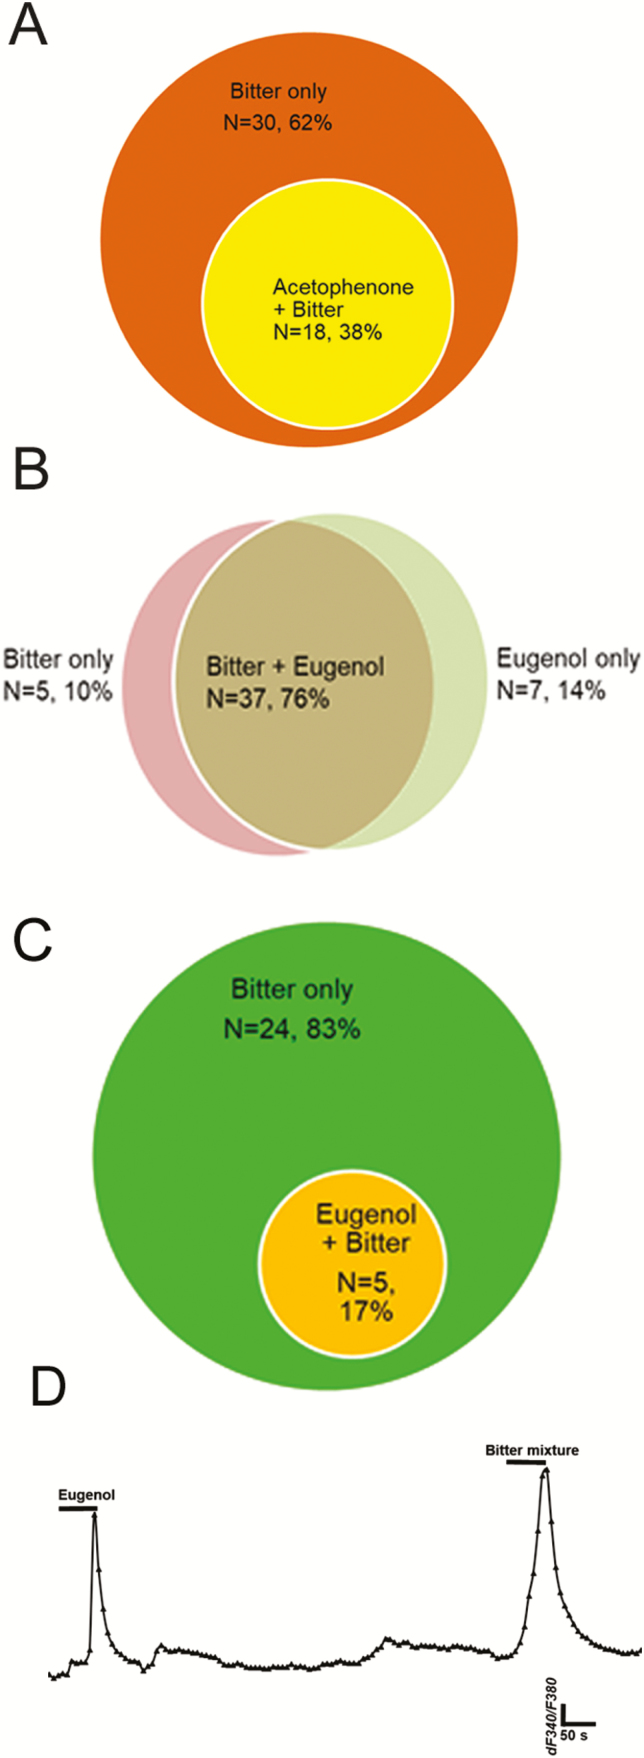
Figure 9.
Breadth of tuning of bitter-responsive taste cells to odorants acetophenone and eugenol. Venn diagrams show numbers of taste cells sensitive to bitter taste stimuli and to olfactory stimuli. (A): 38% (n = 18 of 48) of taste cells responding to the mixed bitter stimulus also responded acetophenone in M71 transgenic mice. (B): 76% of taste cells (n = 37 of 52) responded to both mixed bitter stimulus and eugenol in mEG transgenic mice; 10% and 14% of total responding cells responded to mixed bitter stimulus only or eugenol only, respectively. (C) and (D): In HBO cells, 83% of responding cells (n = 24 of 29) responded only to mixed bitter stimulus; 17% of cells (n = 5 of 29) responded to both eugenol and mixed bitter stimulus, indicating possible peripheral interaction with certain types of odor and taste receptors. (D): A representative recording from single cell which responsive to both eugenol and bitter mixture.

