
Fig 4.
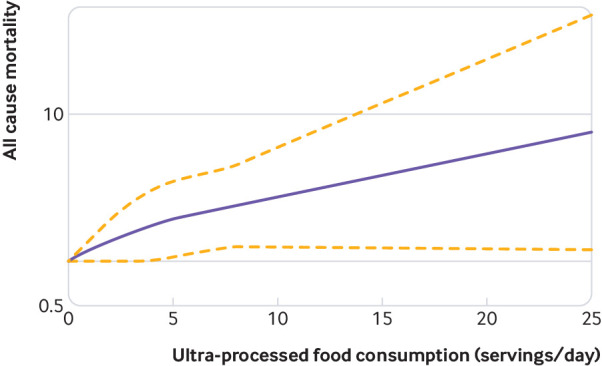
Restricted cubic splines analysis of association between consumption of ultra-processed foods and all cause mortality. Dotted lines represent 95% confidence intervals
Official websites use .gov
A
.gov website belongs to an official
government organization in the United States.
Secure .gov websites use HTTPS
A lock (
) or https:// means you've safely
connected to the .gov website. Share sensitive
information only on official, secure websites.
Restricted cubic splines analysis of association between consumption of ultra-processed foods and all cause mortality. Dotted lines represent 95% confidence intervals