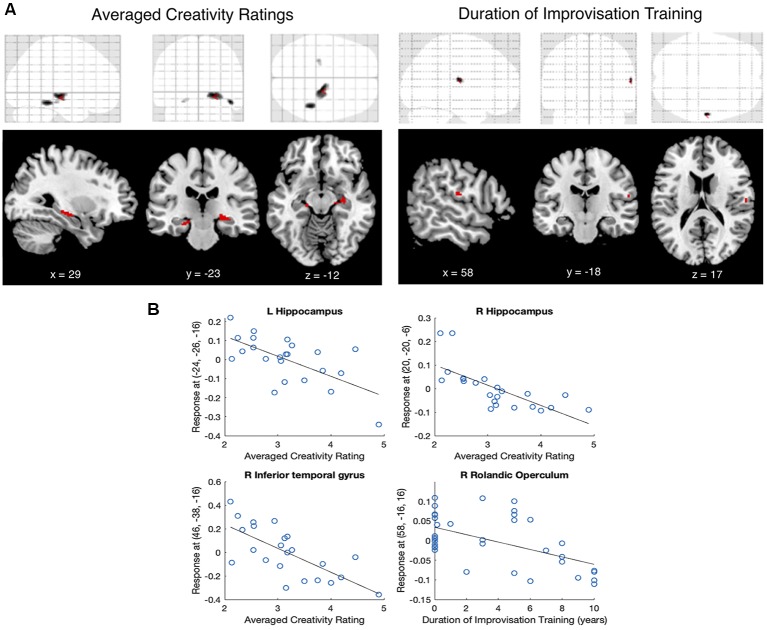
Figure 2.
(A) Voxel-based morphometry (VBM) regression on averaged creativity ratings and the duration of improvisation training (T > 3.53, p < 0.001, k > 10). Top row shows glass-brain representations of the whole-brain regressions; Bottom row shows significant clusters overlaid on a T1 template. (B) Scatterplots showing relationships between averaged creativity ratings and gray matter signal at left and right hippocampus, between averaged creativity ratings and right inferior temporal gyrus, and between the duration of improvisation training and the right rolandic operculum.

