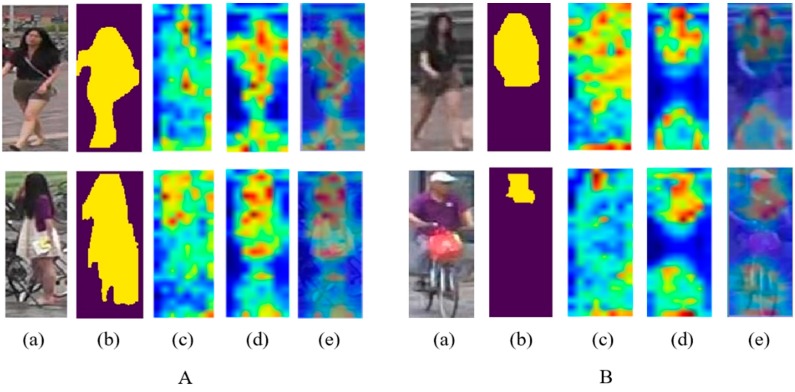
Figure 4.
Comparison of saliency maps between different methods. Group A denotes images with relatively complete masks, while group B are with incomplete masks. In both A and B, (a) and (b) are input RGB images and masks through segmentation. (c) to (e) are: Saliency maps from traditional baseline method, saliency maps from our method with a dynamic part-attention branch, and overlay results between (a) and (d) for better visualization. Best viewed on a color screen.

