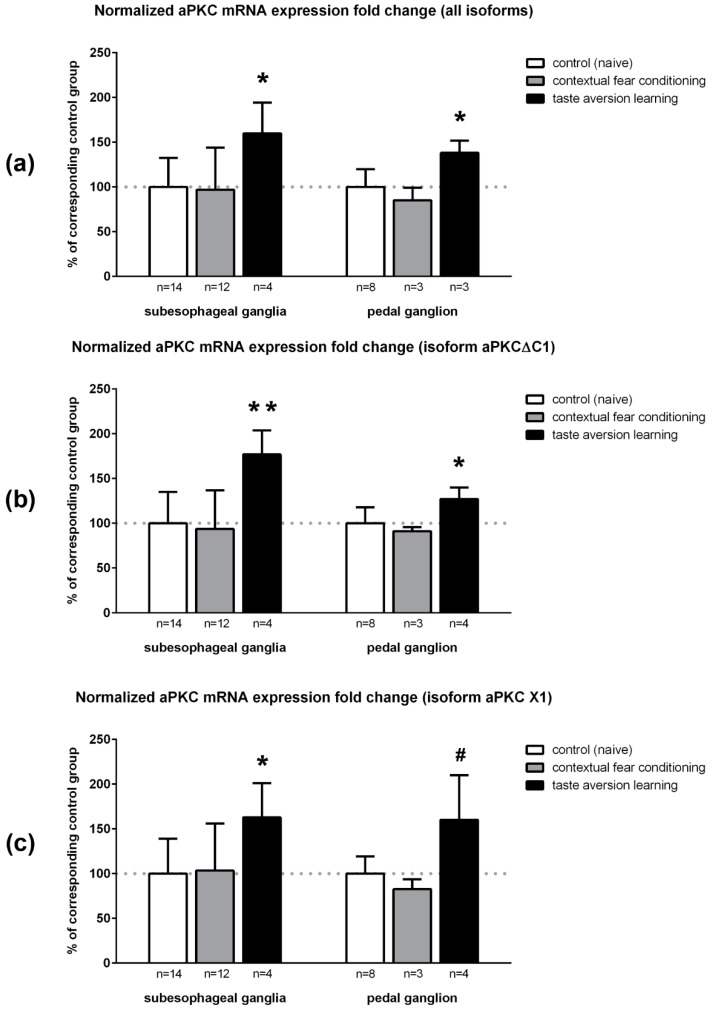
Figure 6.
Normalized mRNA expression fold changes of total aPKC and two its isoforms in subesophageal and pedal ganglia of naive (control) snails and in two test groups of trained snails: (a) total aPKC; (b) aPKCΔC1 isoform; and (c) aPKC X1 isoform. Data are present as normalized AM ± SD. Horizontal dotted lines mark 100% level. * p < 0.05, ** p < 0.005, # p = 0.073 (Mann–Whitney test) compared to control.

