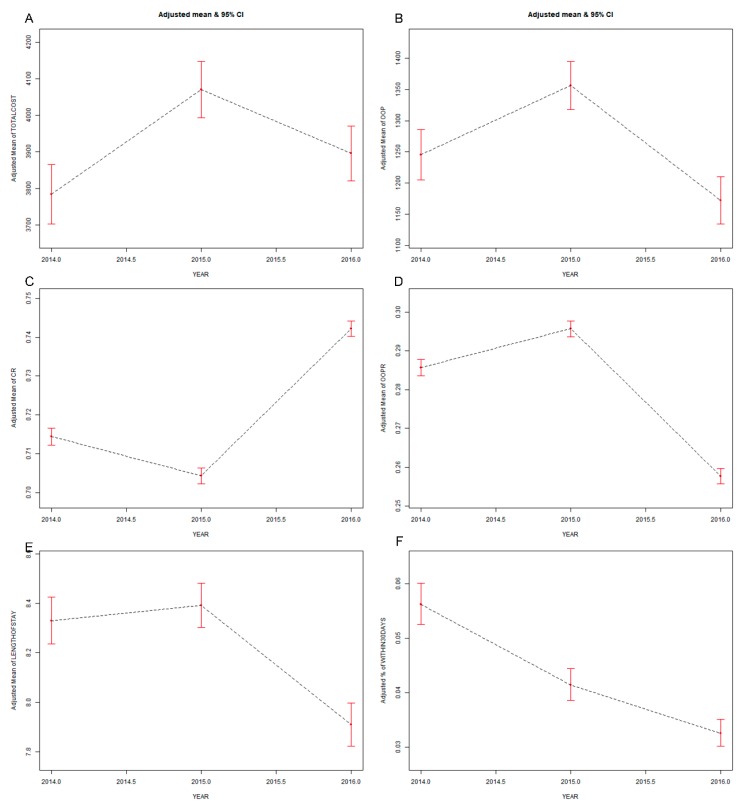
Figure 1.
Direct economic burden and service quality for the whole sample. Ordinate: (A) adjusted mean of total costs; (B) adjusted mean of out-of-pocket (OOP) expenditures; (C) adjusted mean of the compensation ratio (CR); (D) adjusted mean of the OOP ratio; (E) adjusted mean of length of stay; (F) adjusted mean of the 30-day readmission (R30) rate.

