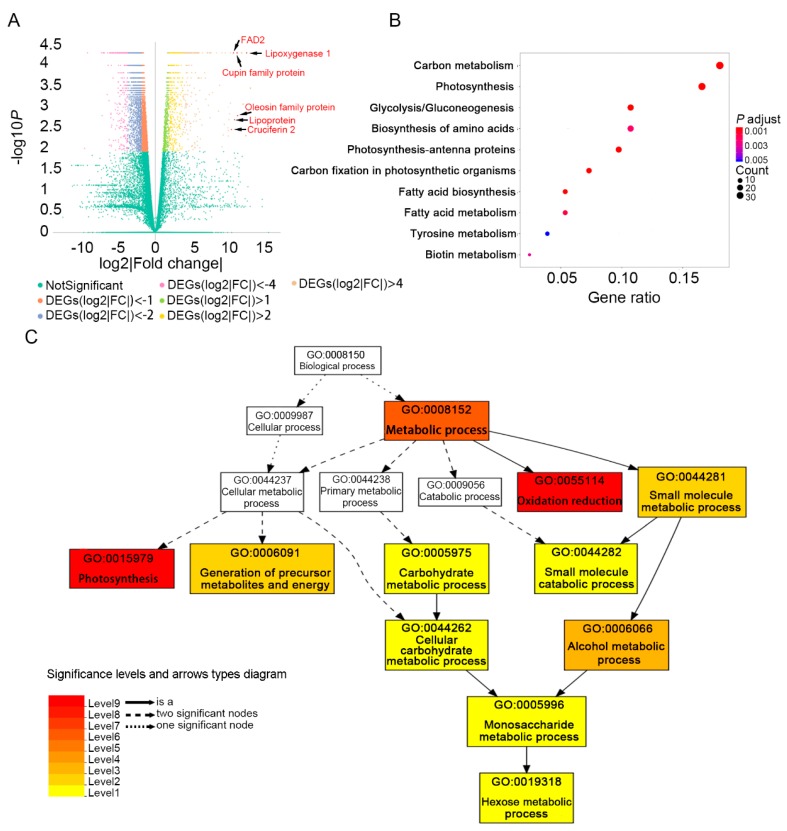
Figure 4.
Functional analysis of DEGs comparing 20 DAF with 10 DAF in developing soybean seeds. (A) Volcano plot of differentially expressed genes. The x-axis shows log2|Fold change| in expression and the y-axis represents the minus log10 (p value) of a gene being differentially expressed. log2|Fold change| = log2 (FPKM_20 DAF)- log2(FPKM_10 DAF). Genes related to lipid metabolism or lipid storage in the top 10 up-regulated DEGs at 20 DAF vs. 10 DAF are marked by red points and black arrows. (B) Top 10 enriched KEGG pathways of up-regulated genes comparing 20 DAF with 10 DAF (p < 0.01). The colors of dots represent the p values relative to the other displayed pathways and the dot size represents the number of genes in the pathway. The x-axis shows gene ratio and y-axis shows the pathway. Gene ratio is the ratio of up-regulated gene number (comparing 20 DAF with 10 DAF) to the soybean genome-wide number in a certain pathway. (C) Gene ontologies (GO) enrichment analysis (in biological process) of up-regulated genes comparing 20 DAF with 10 DAF (FDR < 0.01). The numbers and names of GO terms are shown in boxes. Box colors indicate levels of statistical significance: Level 1 p = 0.05, Level 2 p = 5 × 10⁻³, Level 3 p = 5 × 10⁻⁴, Level 4 p = 5 × 10⁻⁵, Level 5 p = 5 × 10⁻⁶, Level 6 p = 5 × 10⁻⁷, Level 7 p = 5 × 10⁻⁸, Level 8 p = 5 × 10⁻⁹, Level 9 p = 5 × 10⁻¹⁰. Solid, dashed, and dotted lines represent two, one and zero enriched terms at both ends connected by the line, respectively.

