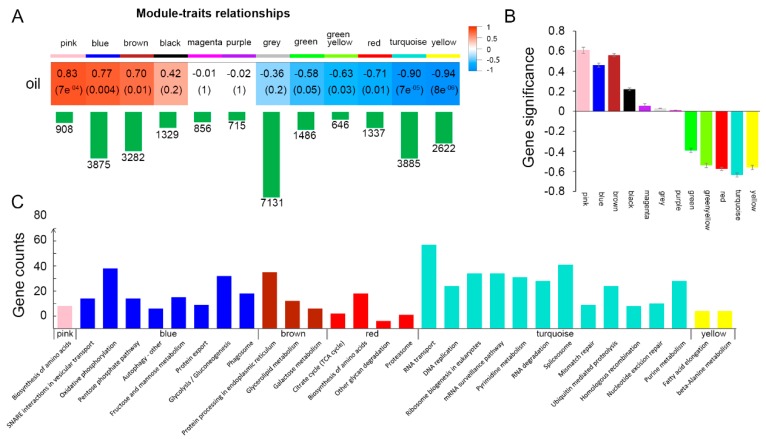
Figure 5.
Correlation between gene co-expression network and oil content in developing soybean seeds. (A) The correlations between gene co-expression modules and oil content. The first colored row represents the modules detected by Weighted Correlation Network Analysis (WGCNA), and the colored cells below represent their correlations with oil content. The corresponding correlation coefficient (top) and p value (bottom) are displayed in each cell. The cells are color-coded by the correlation coefficient (r) as shown by the color key on the right. Red represents positive correlation while blue represents negative correlation. The green bar below each module represents the number of genes in each module. (B) Bar plot represents the average gene significance for each detected module. (C) Enriched pathways in genes of pink, blue, brown, red, turquoise and yellow modules, respectively. The x-axis shows the names of the pathways, and the y-axis displays the gene numbers in each pathway.

