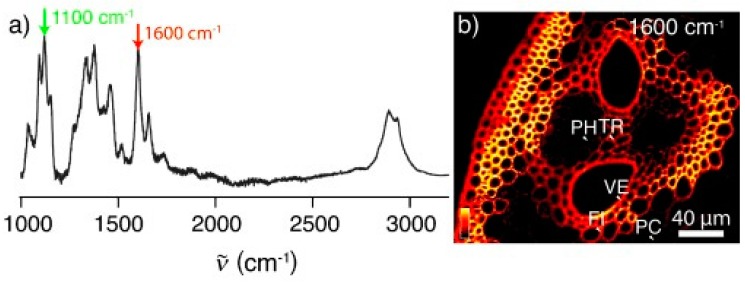
Figure 6.
Raman spectrum and SRS imaging of corn stover. (a) Raman spectrum of raw corn stover. The peak at 1600 cm−1 (red arrow) corresponds to the lignin distribution, and the peak at 1100 cm−1 (green arrow) corresponds to cellulose. (b) SRS image of the vascular bundle including the edge of the stem in raw corn stover at 1600 cm−1, showing the lignin distribution. Labeled structures are discussed in the text: parenchyma (PC), phloem (PH), vessel (VE), tracheid (TR), fiber (FI). Reproduced with permission from Ref. [61]. Copyright JOHN WILEY AND SONS 2010.

