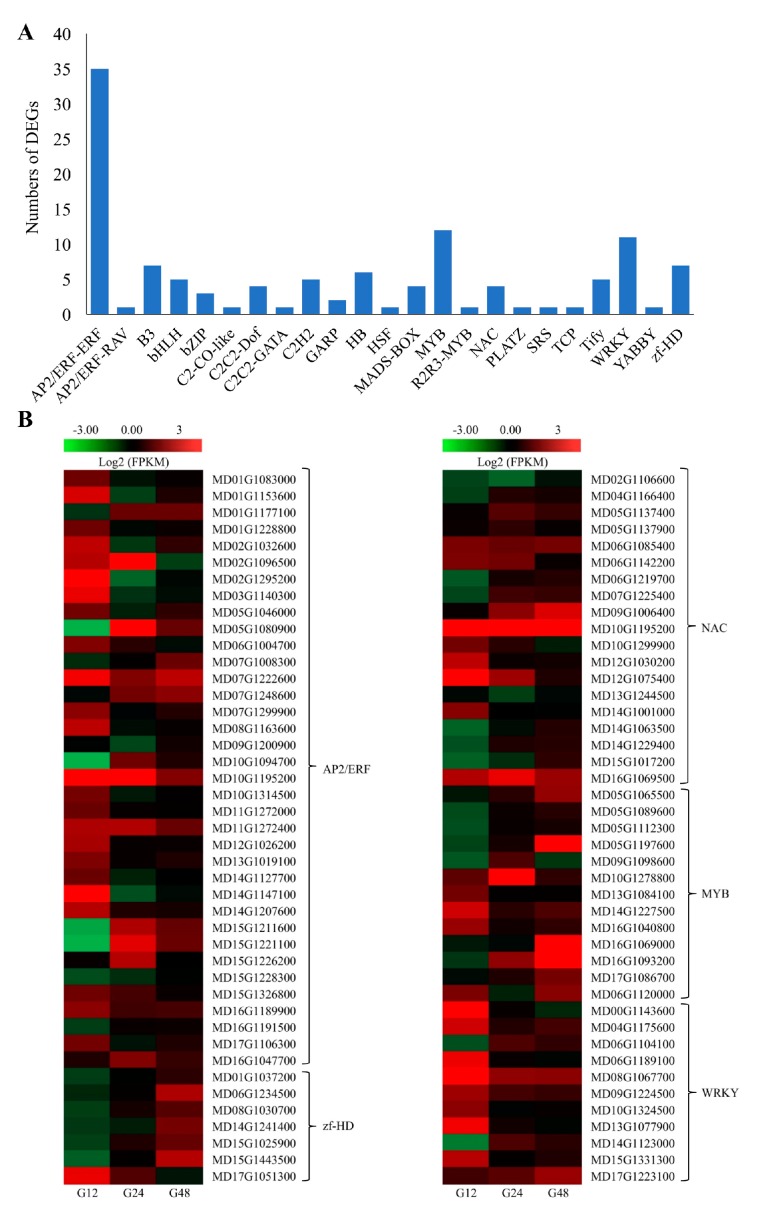
Figure 4.
Transcription factors (TFs) in the differentially expressed genes (DEGs) sets. (A) Number of DEGs in different TF families; (B) expression profiles of genes from different TF families. The maximum/minimum log2FPKM value was set to ± 3.0 (red for upregulated, green for downregulated), each horizontal row represents a DEG with its gene ID, and the vertical columns represent 12, 24 and 48 hpi from left to right.

