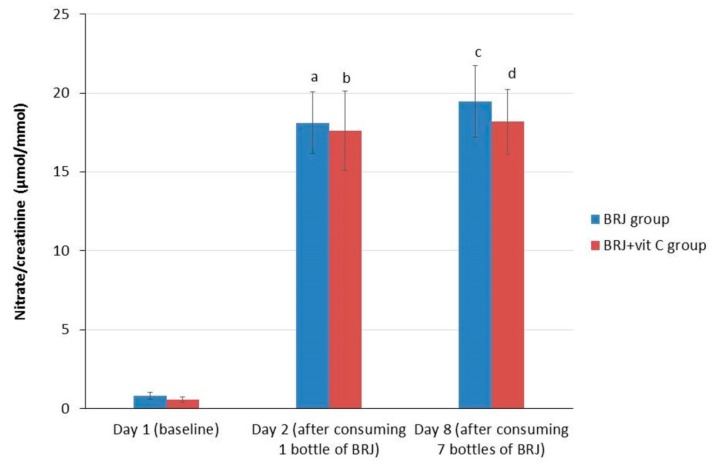
Figure 3.
Average values (± SE) for creatinine corrected nitrate levels in urine for the intervention groups stratified for vitamin C supplementation at baseline (day 1), after consumption of 1 bottle (day 2) and 7 bottles (1 daily, day 8) of beetroot juice. Wilcoxon signed rank test; significant increase compared with baseline. (a) p < 0.001, significant increase at day 2 as compared to baseline levels (day 1) in the BRJ group; (b) p < 0.001, significant increase at day 2 as compared to baseline levels (day 1) in the BRJ + VitC group; (c) p < 0.001, significant increase at day 8 as compared to baseline levels (day 1) in the BRJ group; (d) p < 0.001, significant increase at day 8 as compared to baseline levels (day 1) in the BRJ + VitC group.

