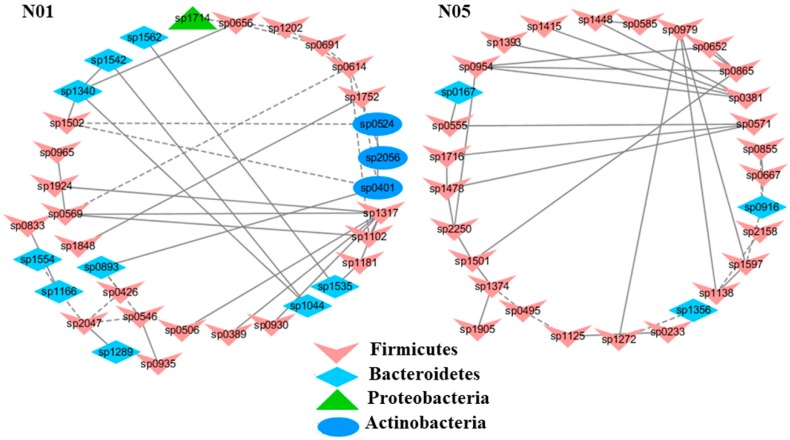
Figure 2.
Select modules displaying a strong correlation with blood urea nitrogen contents (BUN) in healthy mice. The interactions among different nodes (OTUs) within a module were shown: solid line: positive correlation; dashed line: negative correlation. The color of each node (OTU) indicated the phylum that this OTU was assigned to. The detailed annotation of each OTU node can be found in Table S3.

