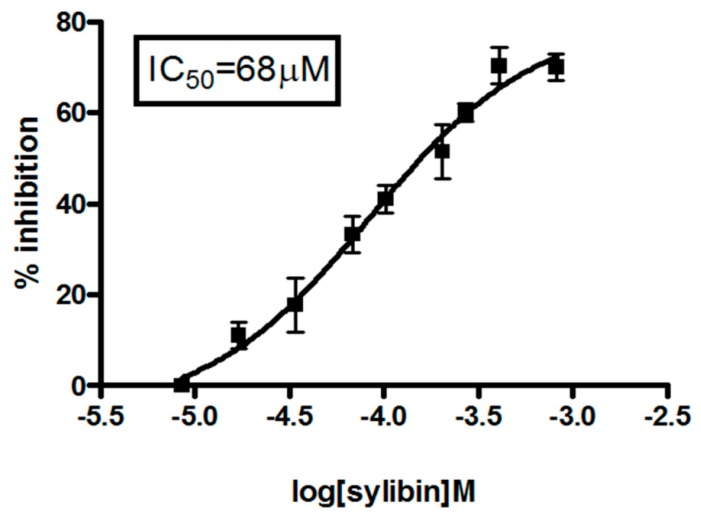
Figure 1.
Dose-response effects of silybin on HCC cells. HepG2 cells were seeded and treated with different concentrations of Silybin (0–200 mM) for 72 h, and thereafter cell viability was assessed as described in “Materials and Methods”. The experiment was repeated three times and the results are the mean of the different data. Bars represent standard deviations.

