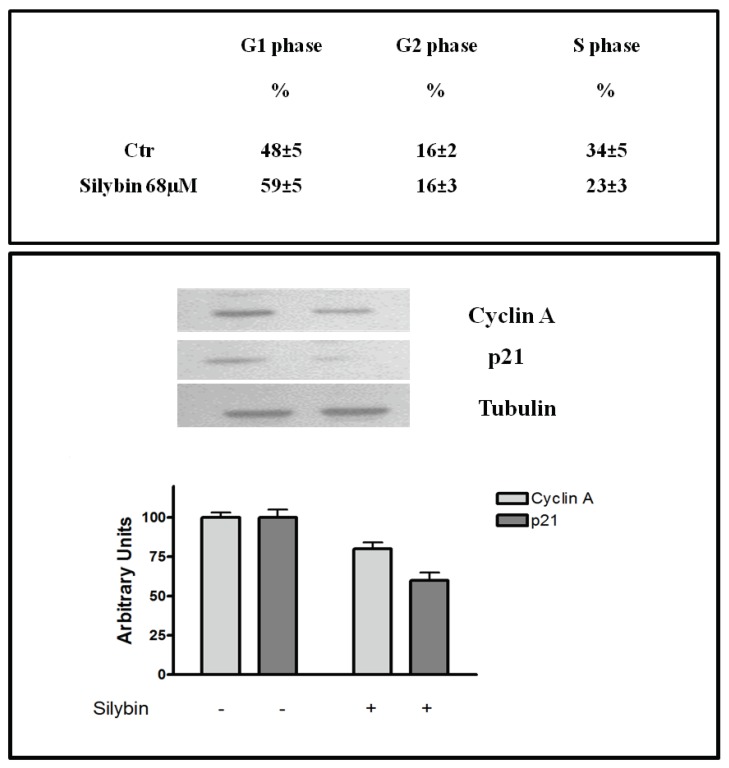
Figure 3.
Effects of silybin on cell cycle. (up) Cell cycle distribution after 72 h of treatment with silybin IC50 (68 μM) in HepG2 cells, evaluated by FACS, as described in Materials and Methods. Data are expressed as mean ± SD of the percentage of cells in the different phases of the cell cycle, as compared with untreated control cells. (down) Effects of silybin on p21 and cyclin A expression in HepG2 cells. γ-tubulin was used as loading control. The intensity of each band was expressed as % arbitrary units compared to that of the untreated cells. Error bars showed standard deviation from the mean in at least three independent experiments.

