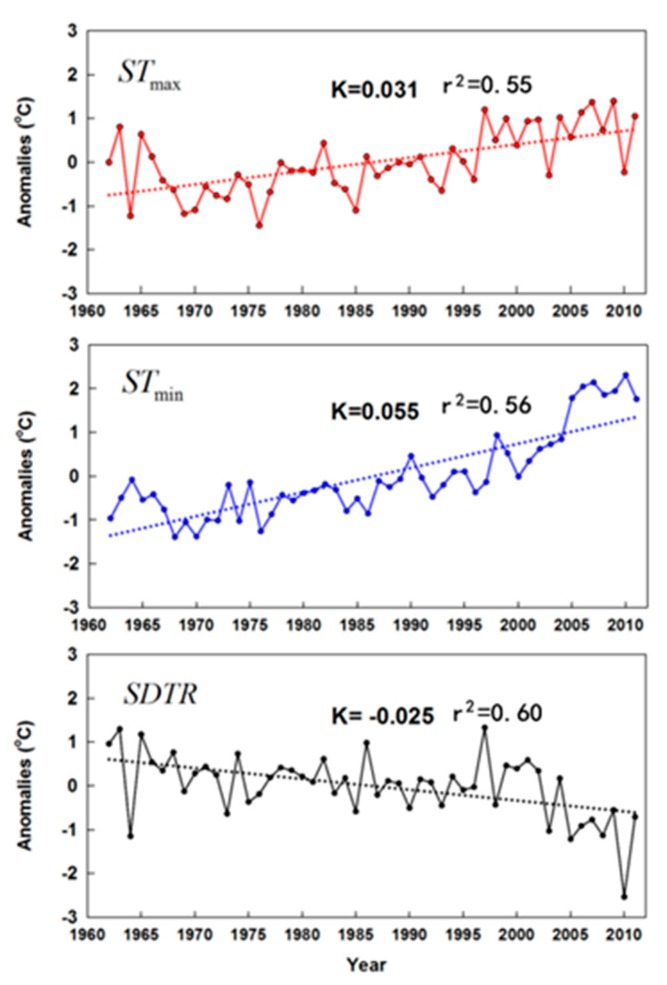
Figure 2.
Linear trends and anomalies from annual means of , , and SDTR in China during 1962–2011. Dashed lines are trend lines. K represents the slope (i.e., rate of change (°C/year)); all the slopes of trends were significant (p < 0.05). Anomaly is the difference between the temperature of one year (corresponding to the X-axis) and the average temperature of 50 years.

